The satellite-retrieved
erythemal UV doses over the period July 1983 to June 2007 were
compared to ground-based measurements at eight European
sites. Following the paper by
Tanskanen et al. (2007), we applied a
threshold filter of 200 J/m2 to the daily doses, so that only doses
exceeding that value were included in the validation analysis.
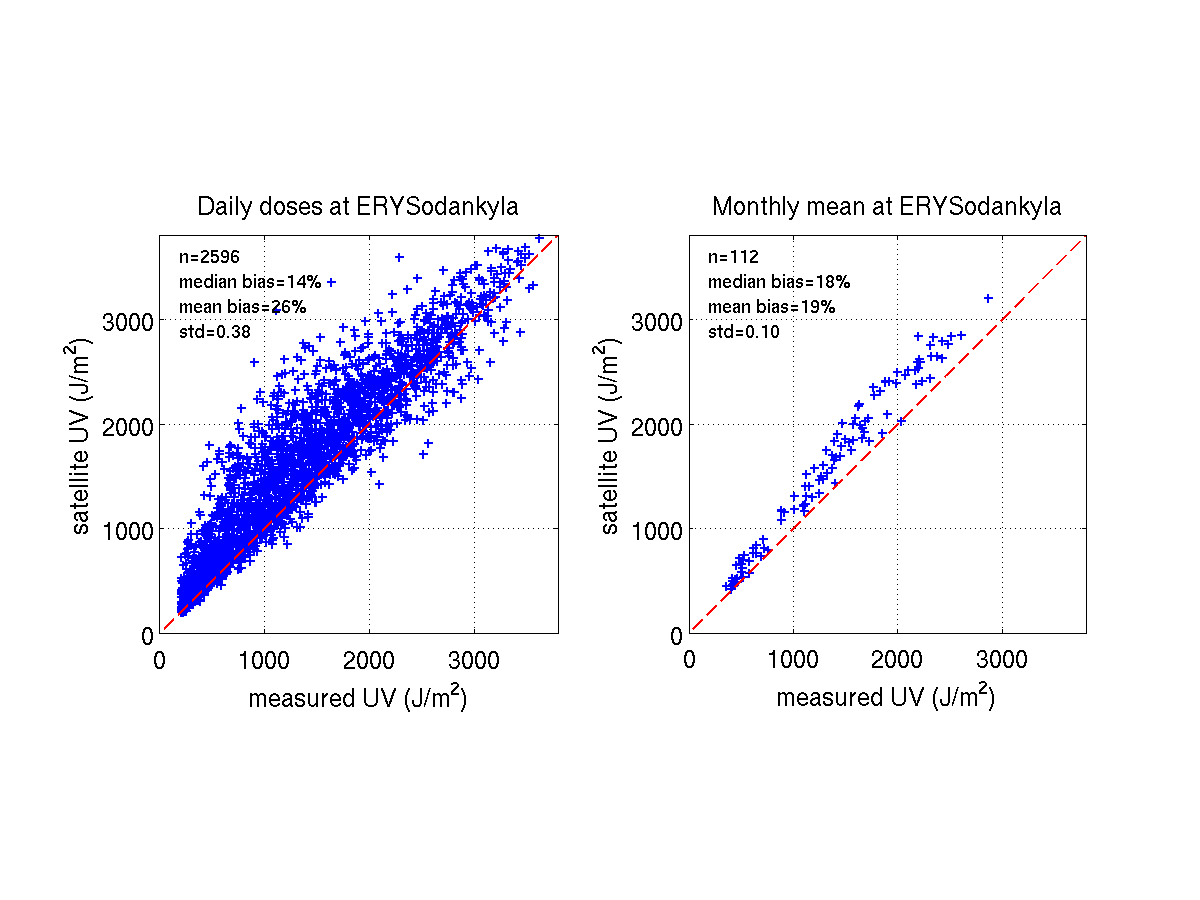
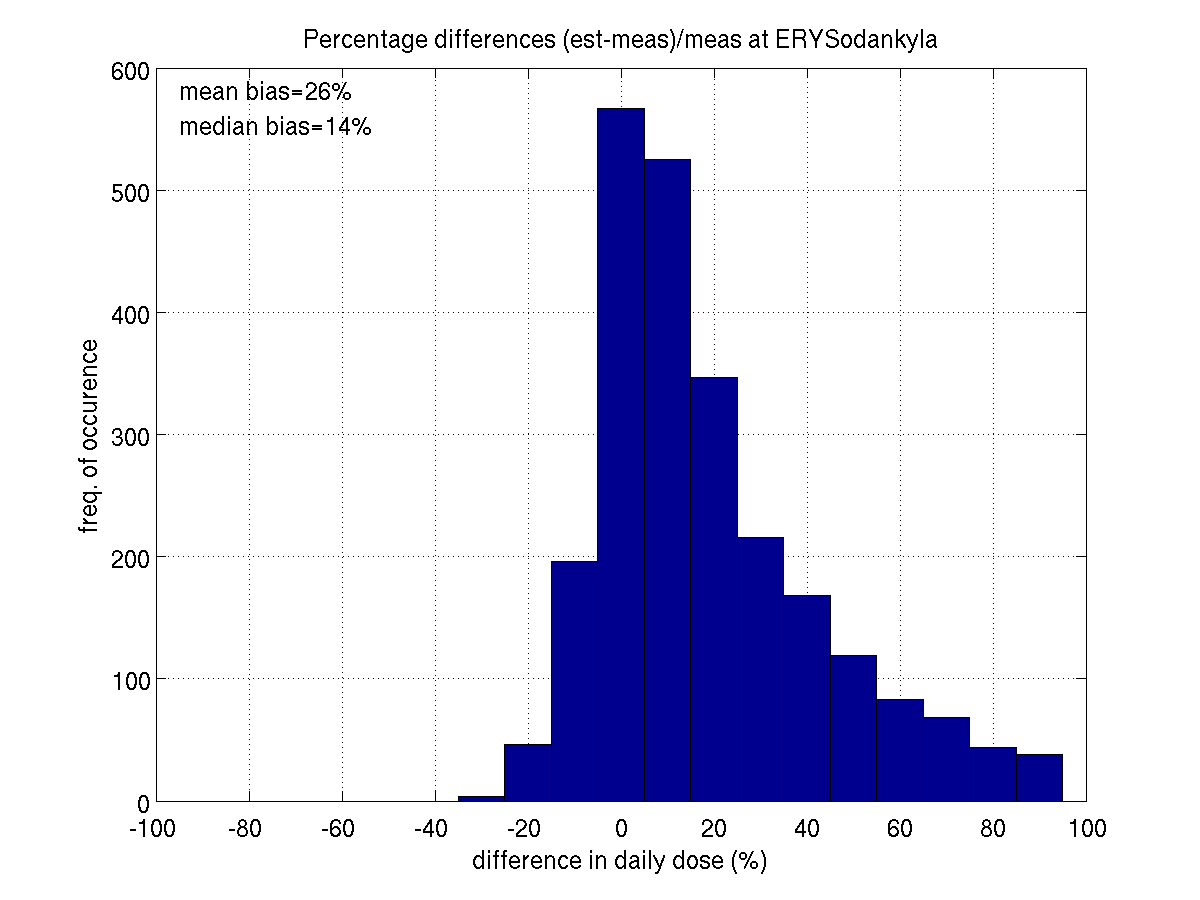
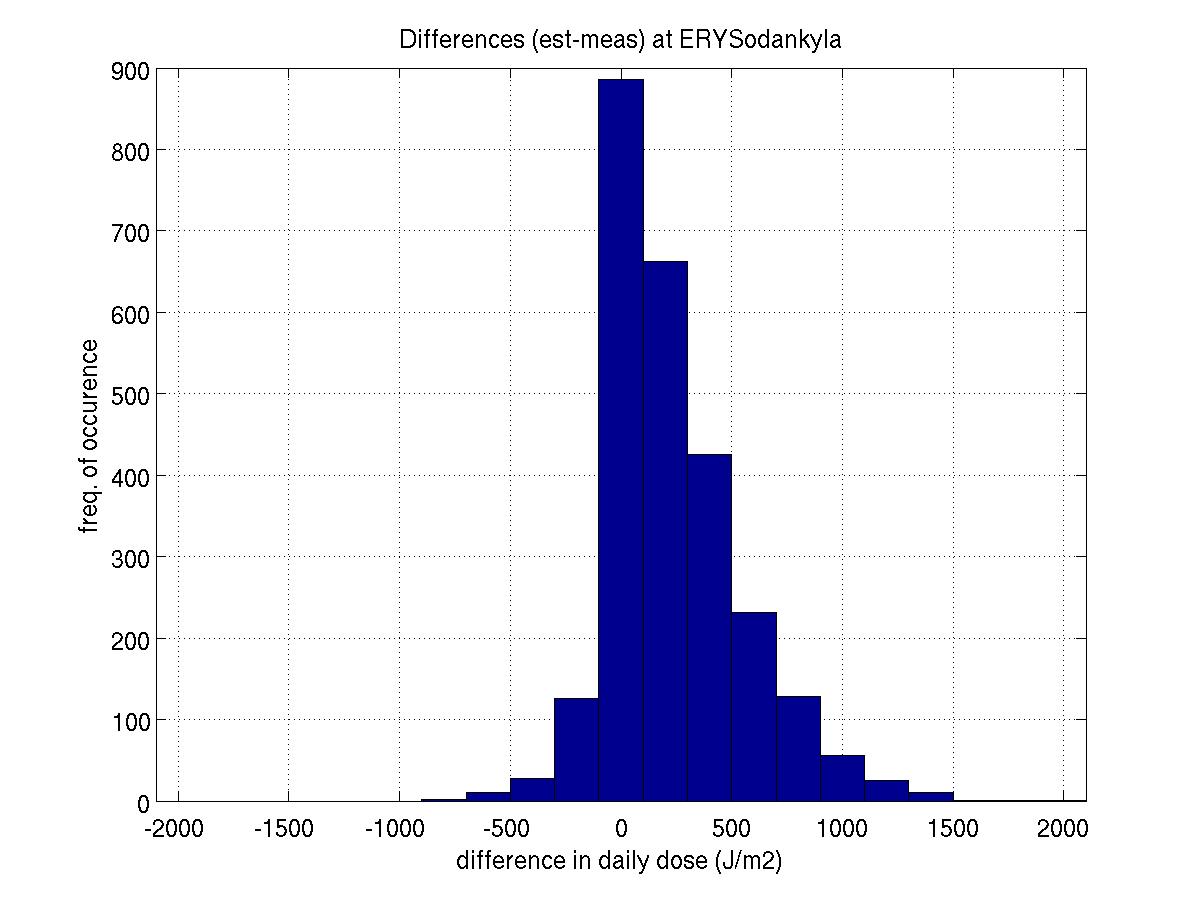
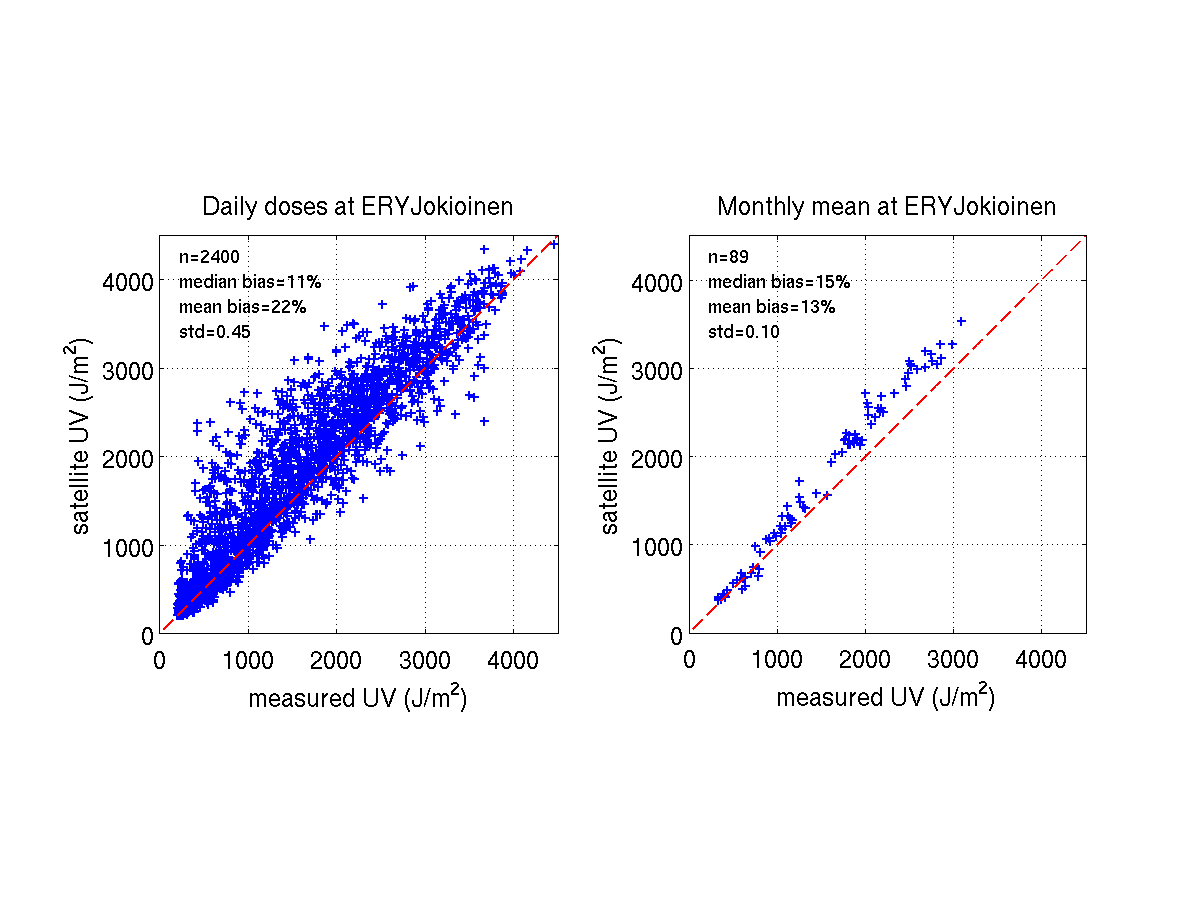
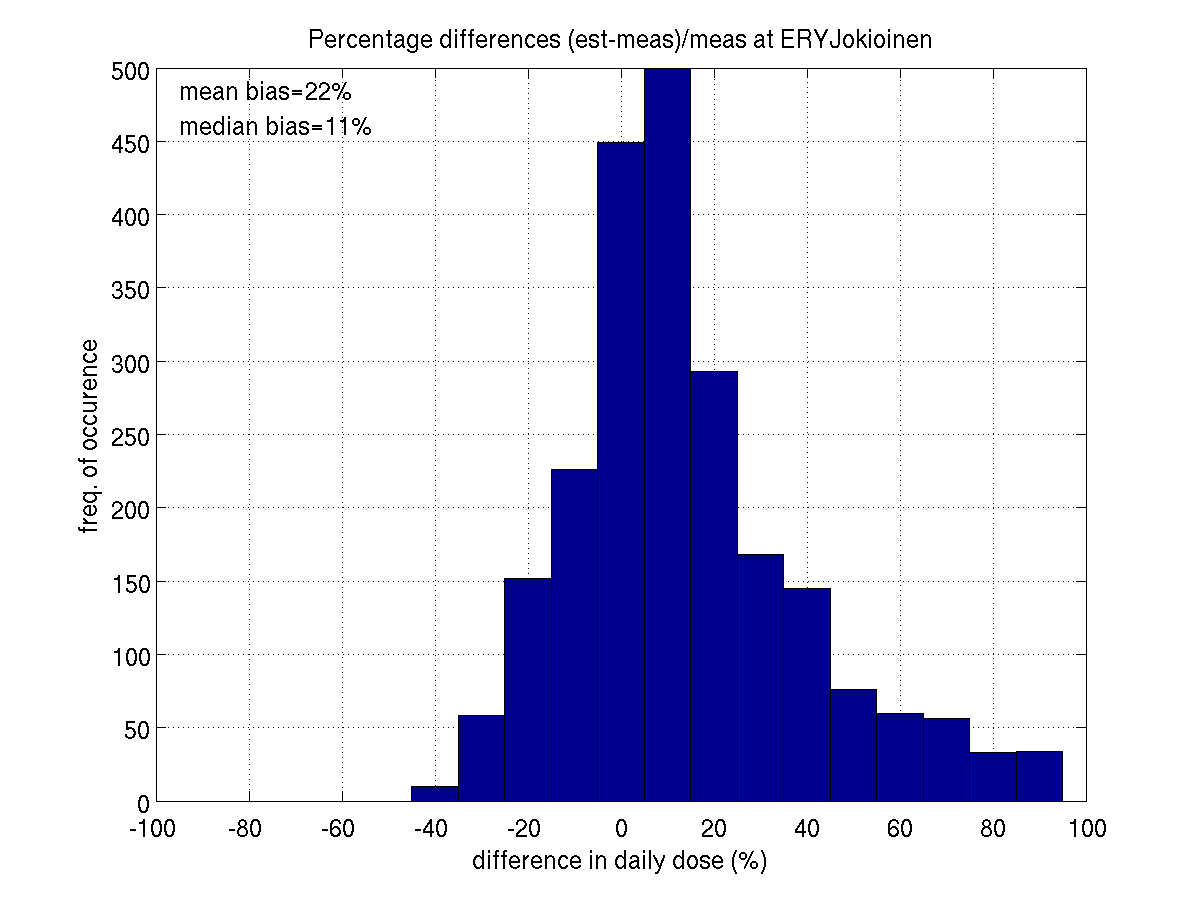
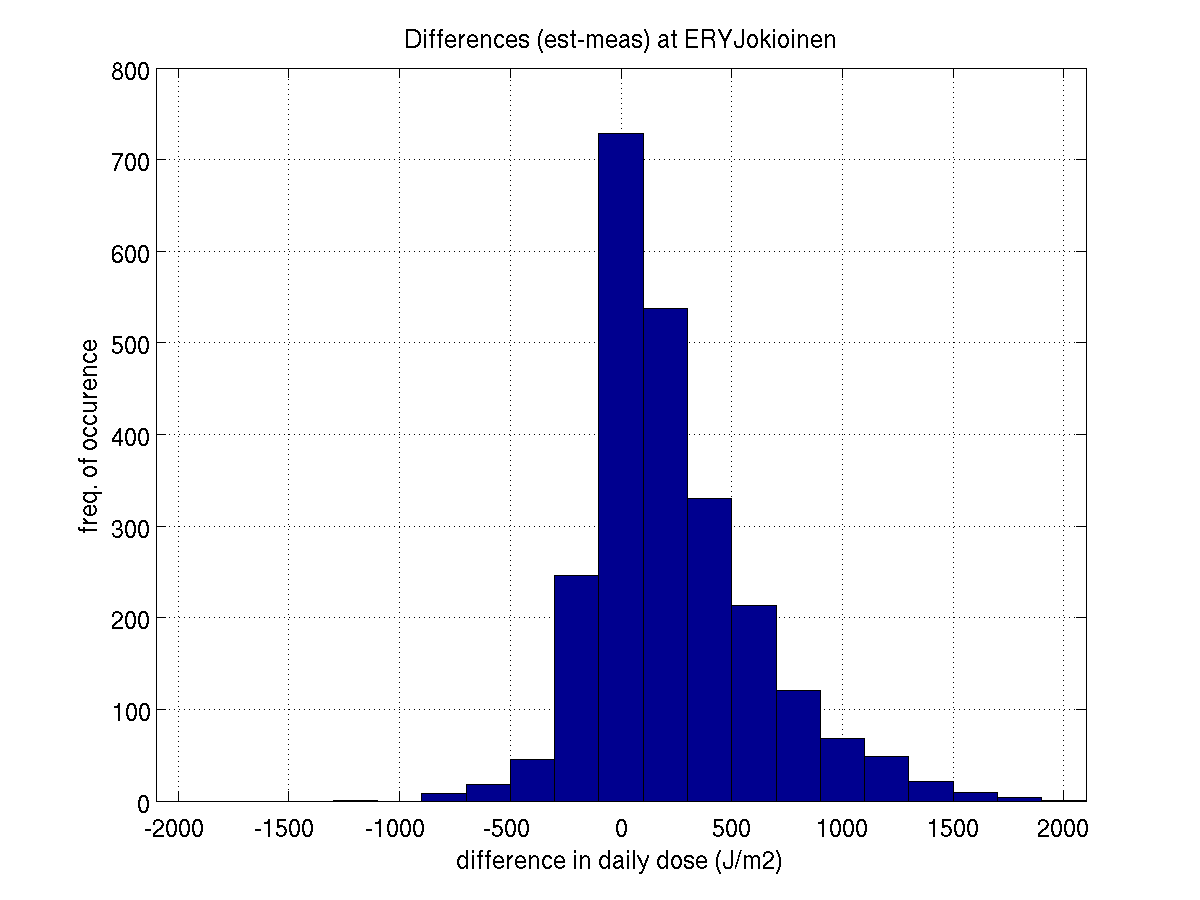
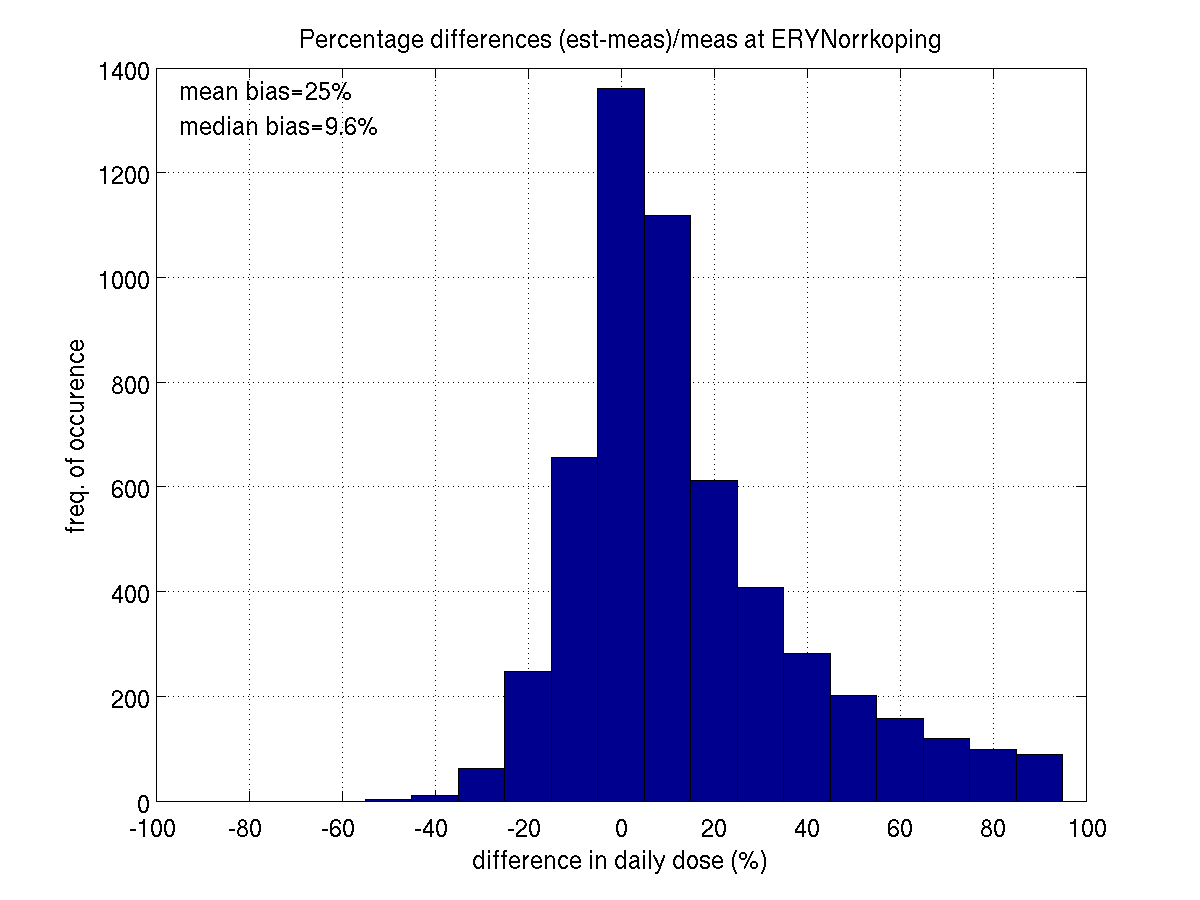
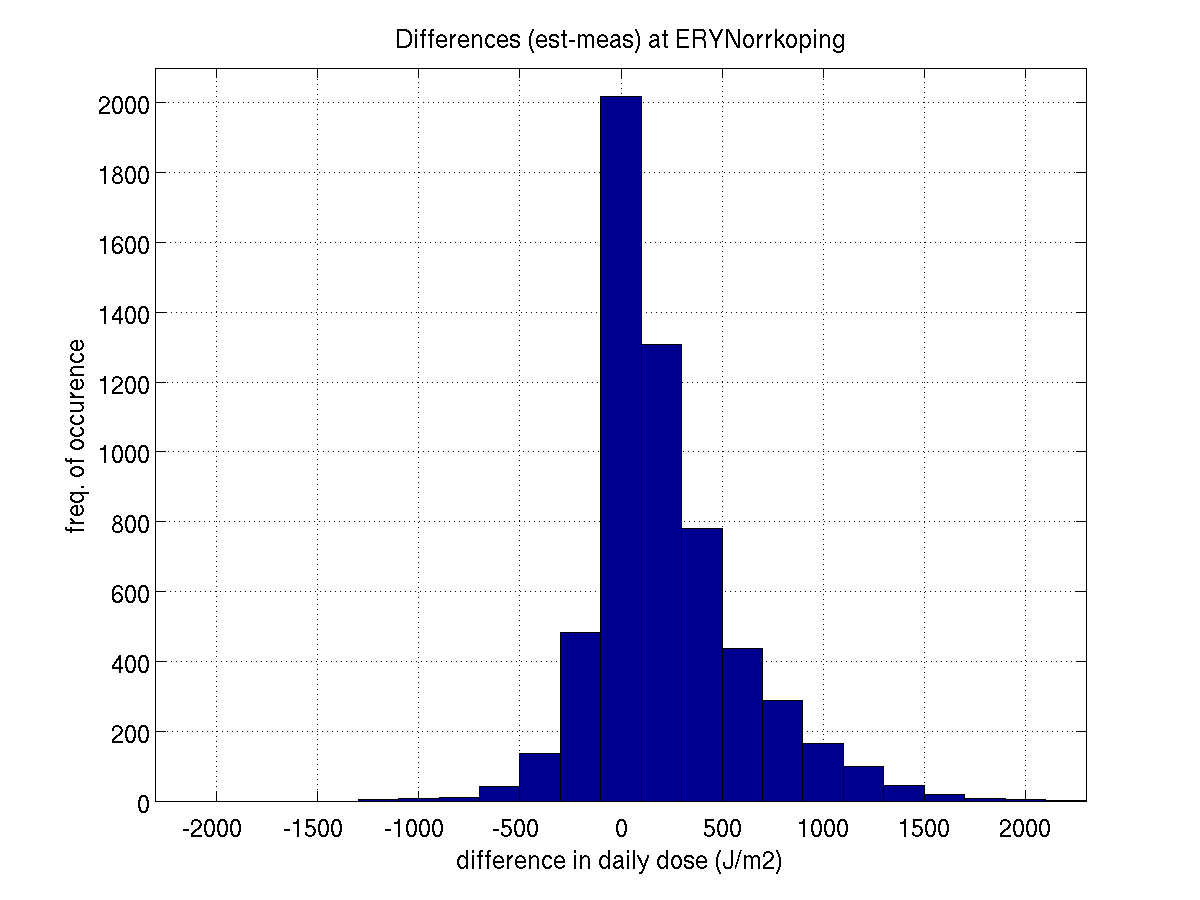
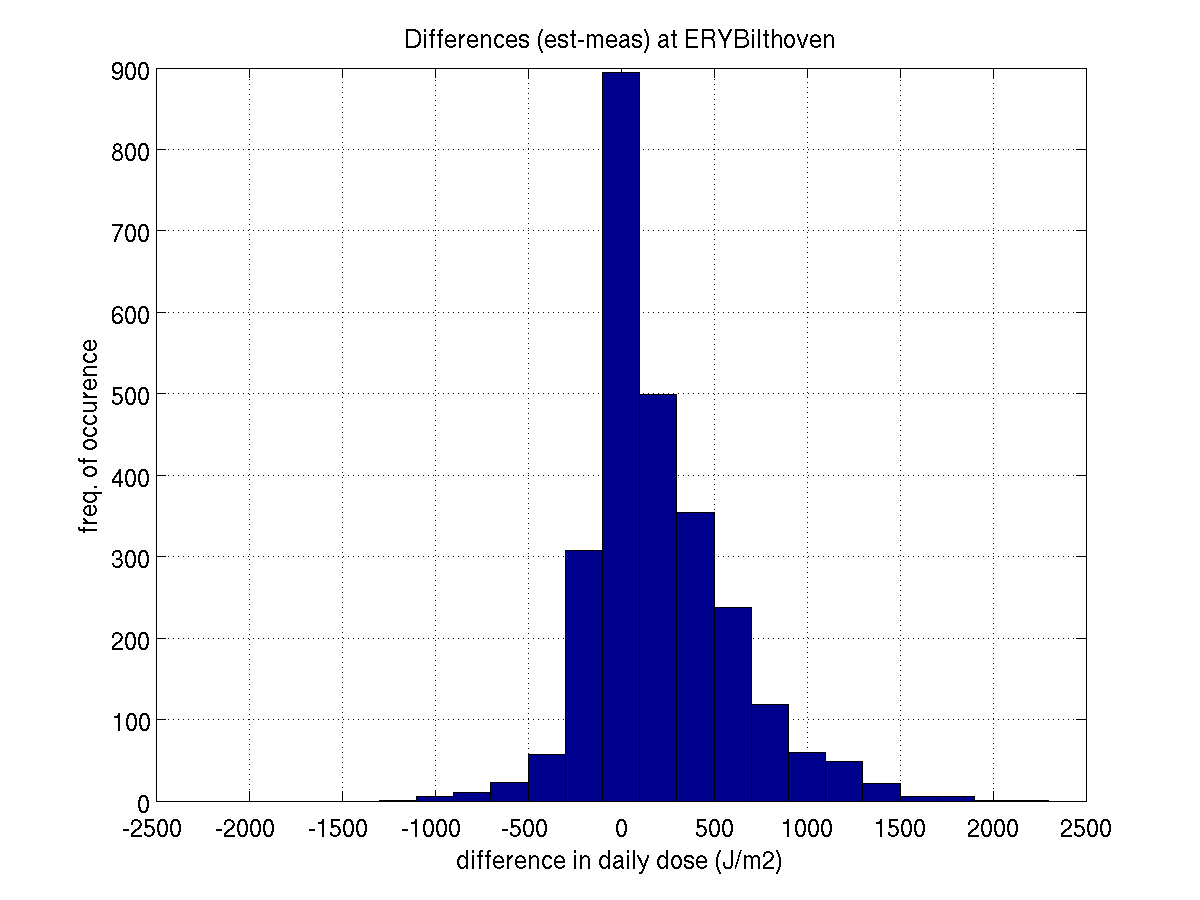
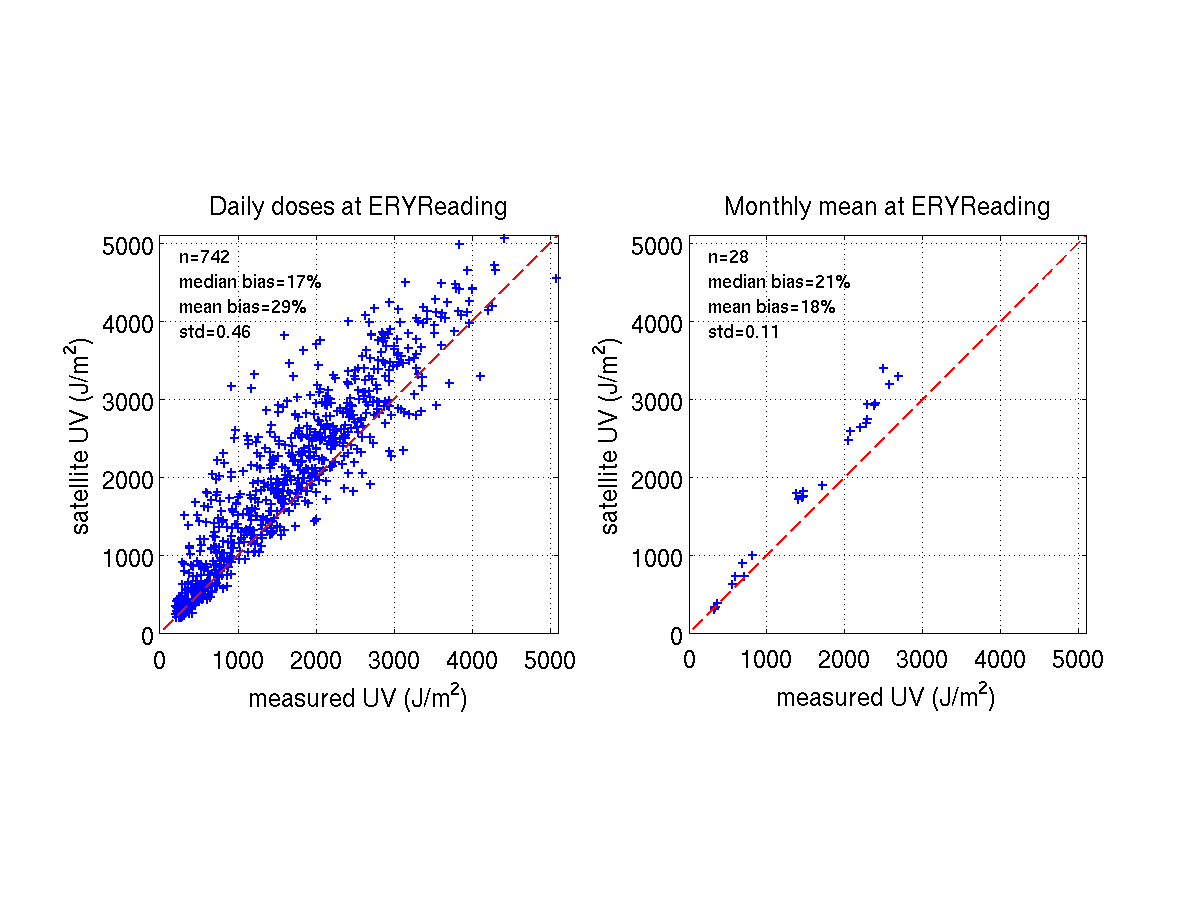
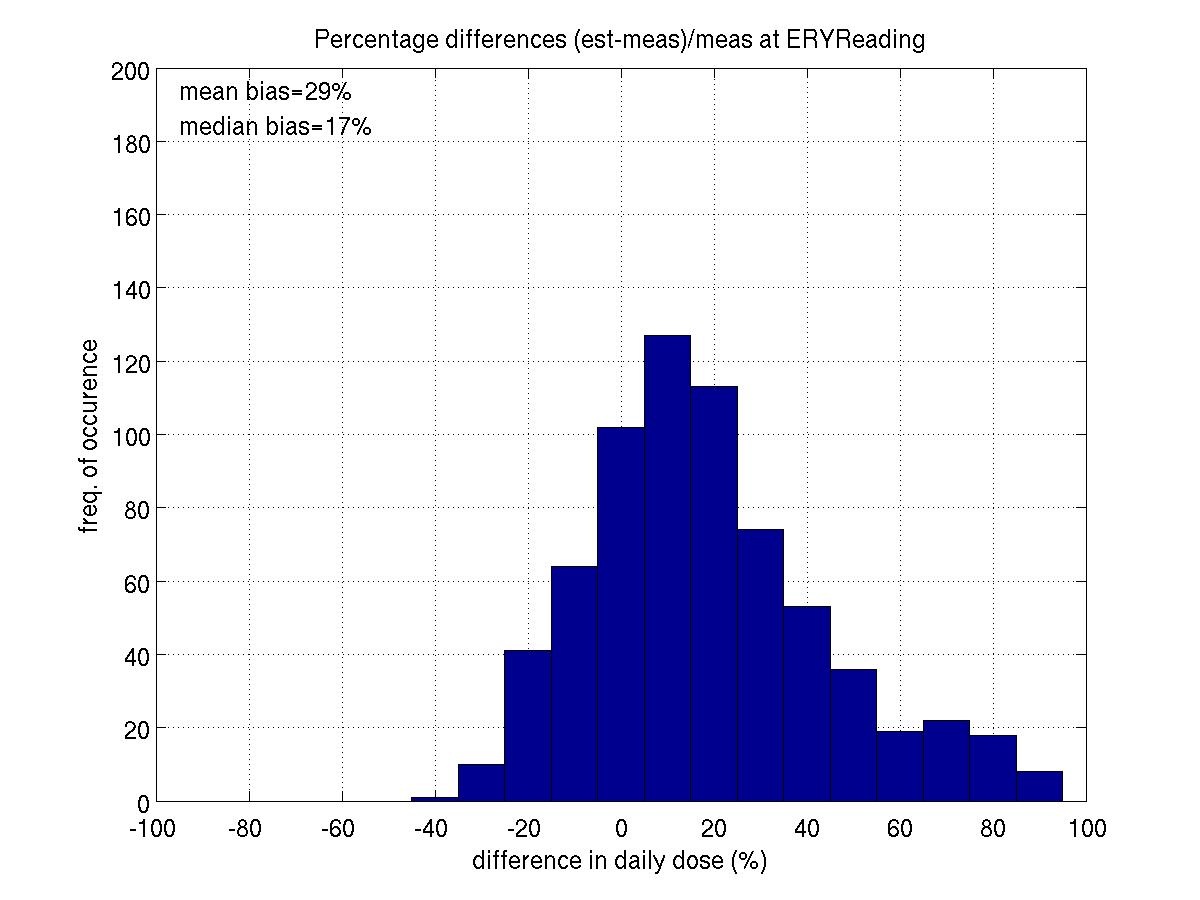
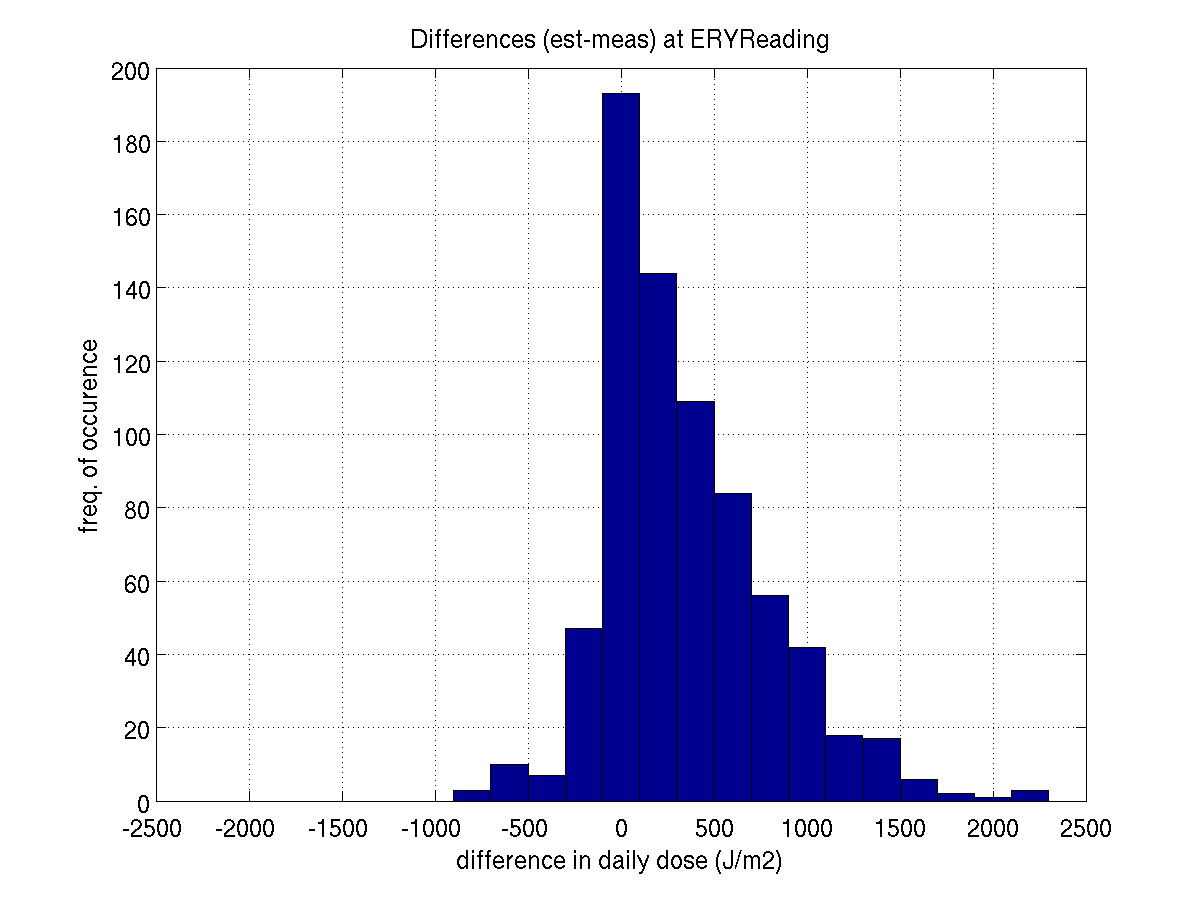
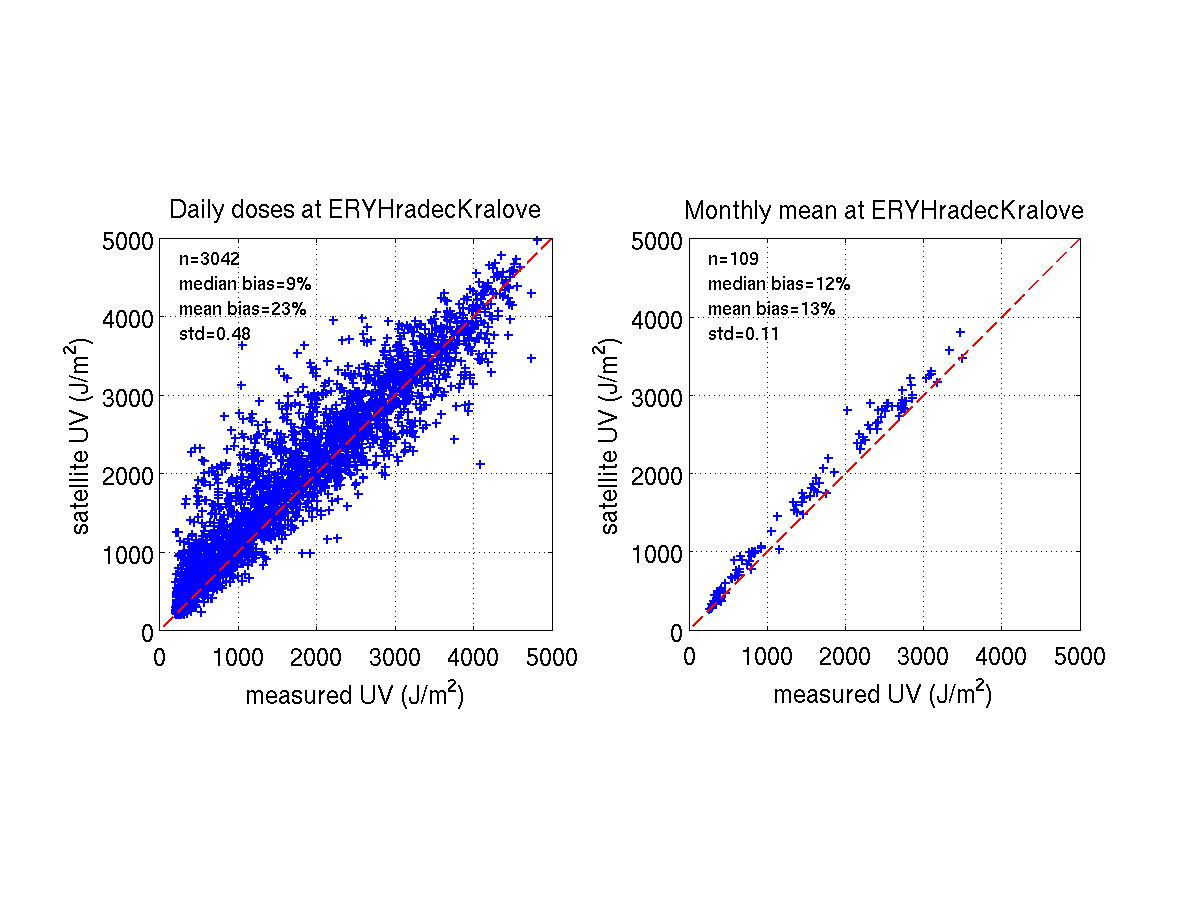
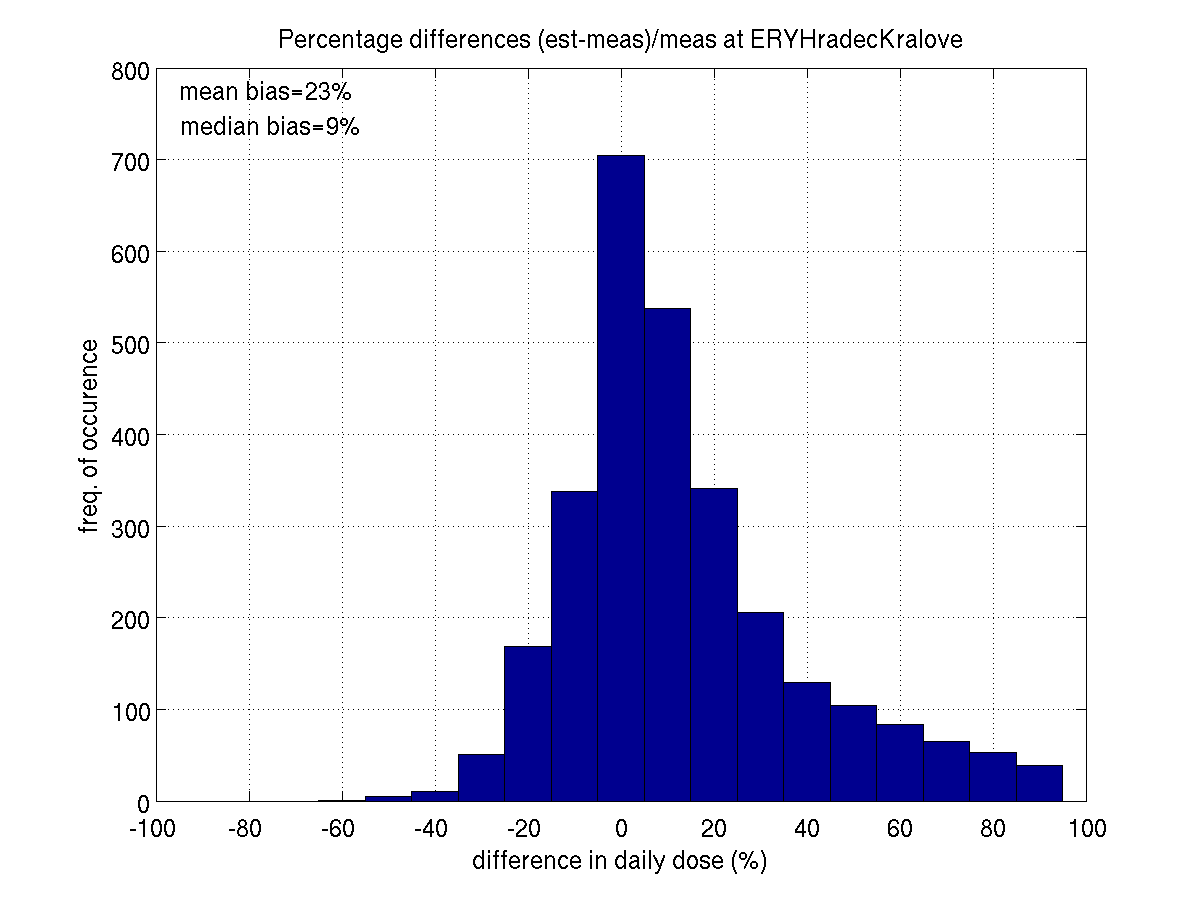
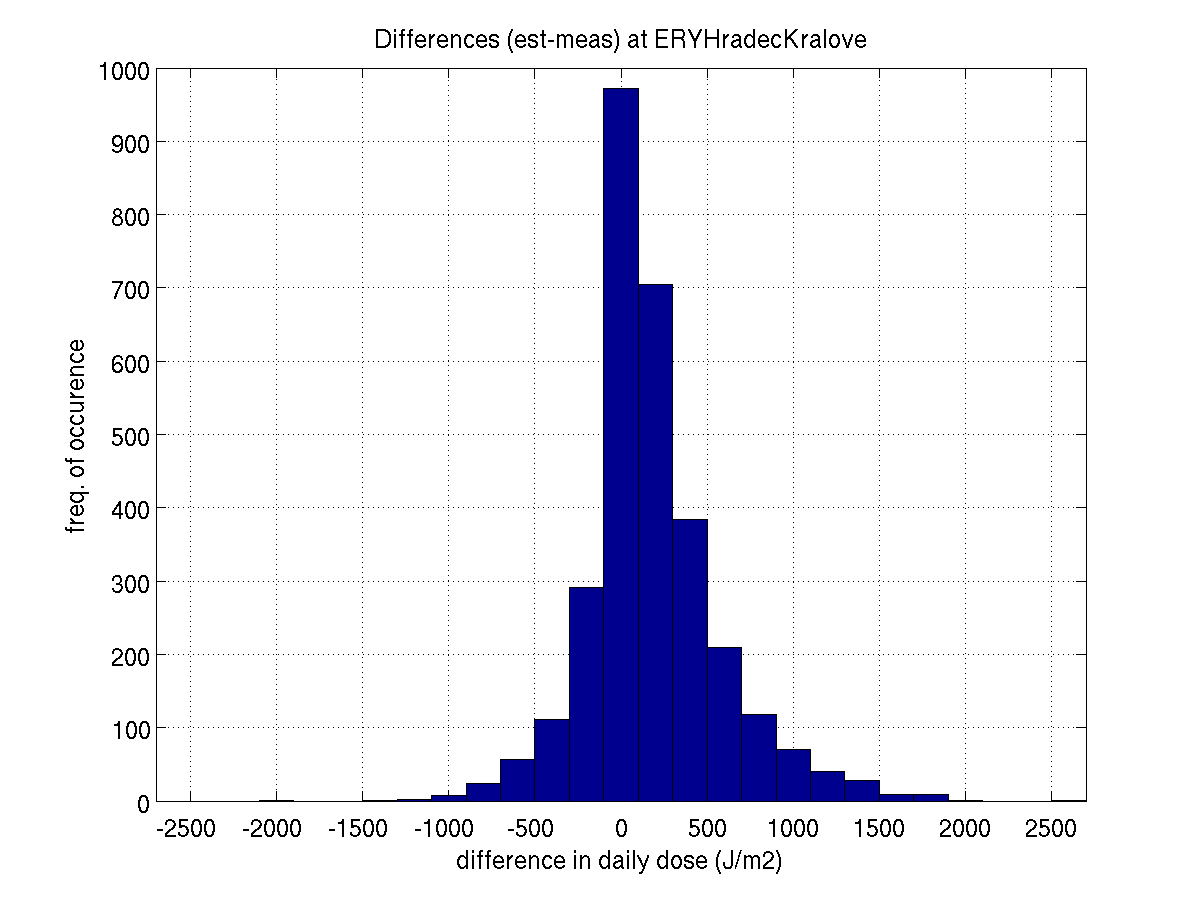
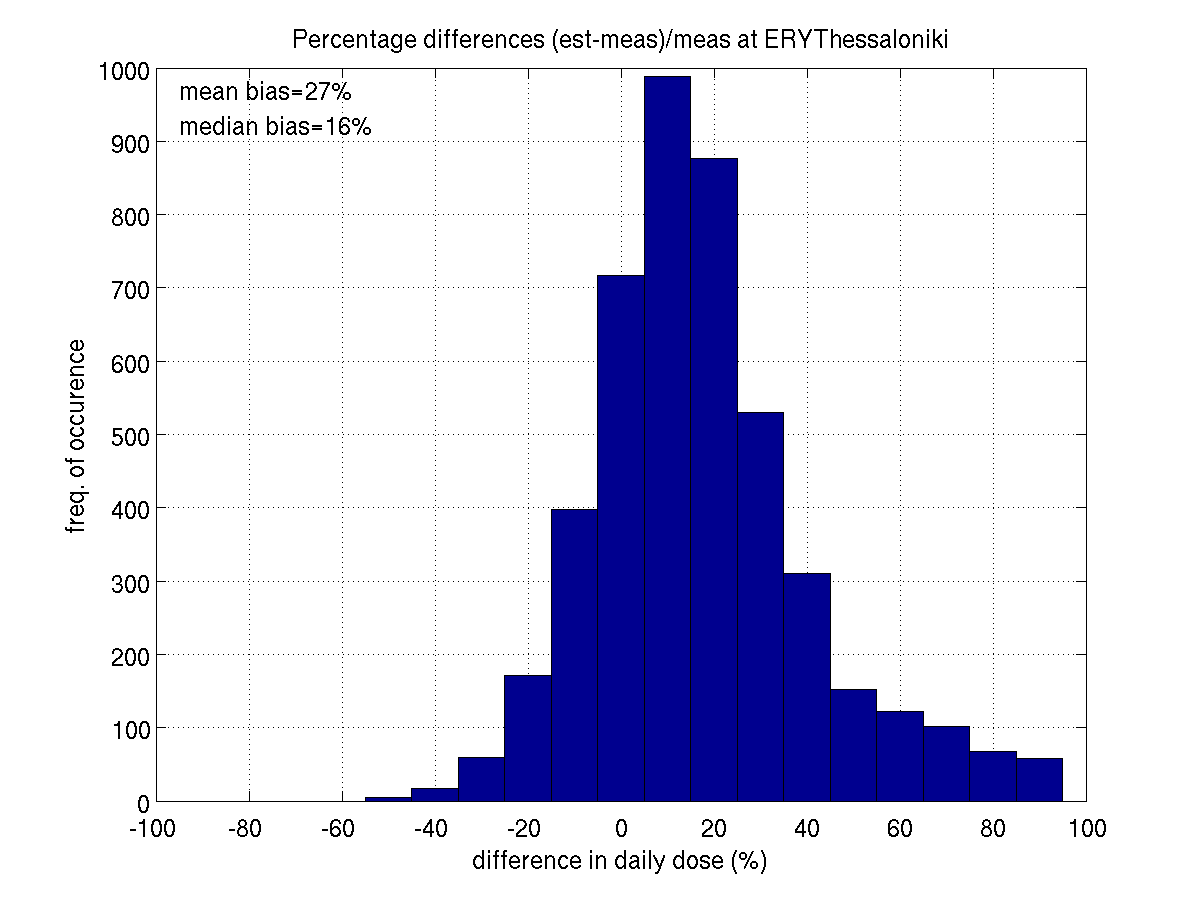
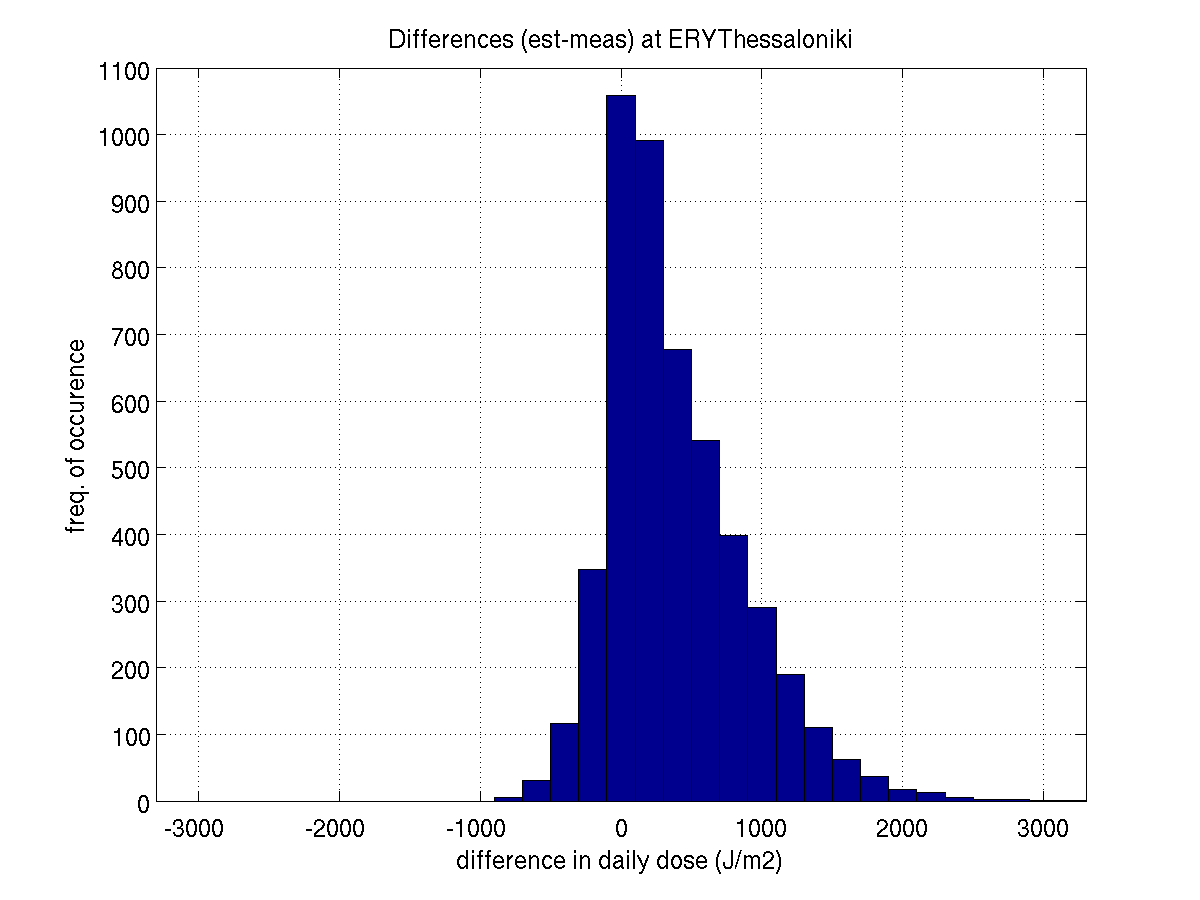
The results detailed in the table beneath show that the new algorithm
for satellite-retrieved UV is working more or less as expected. The
performance is similar to that of the Phase 2 results and also
OMI-retrieved UV in Phase 1, with quite a clear tendency toward
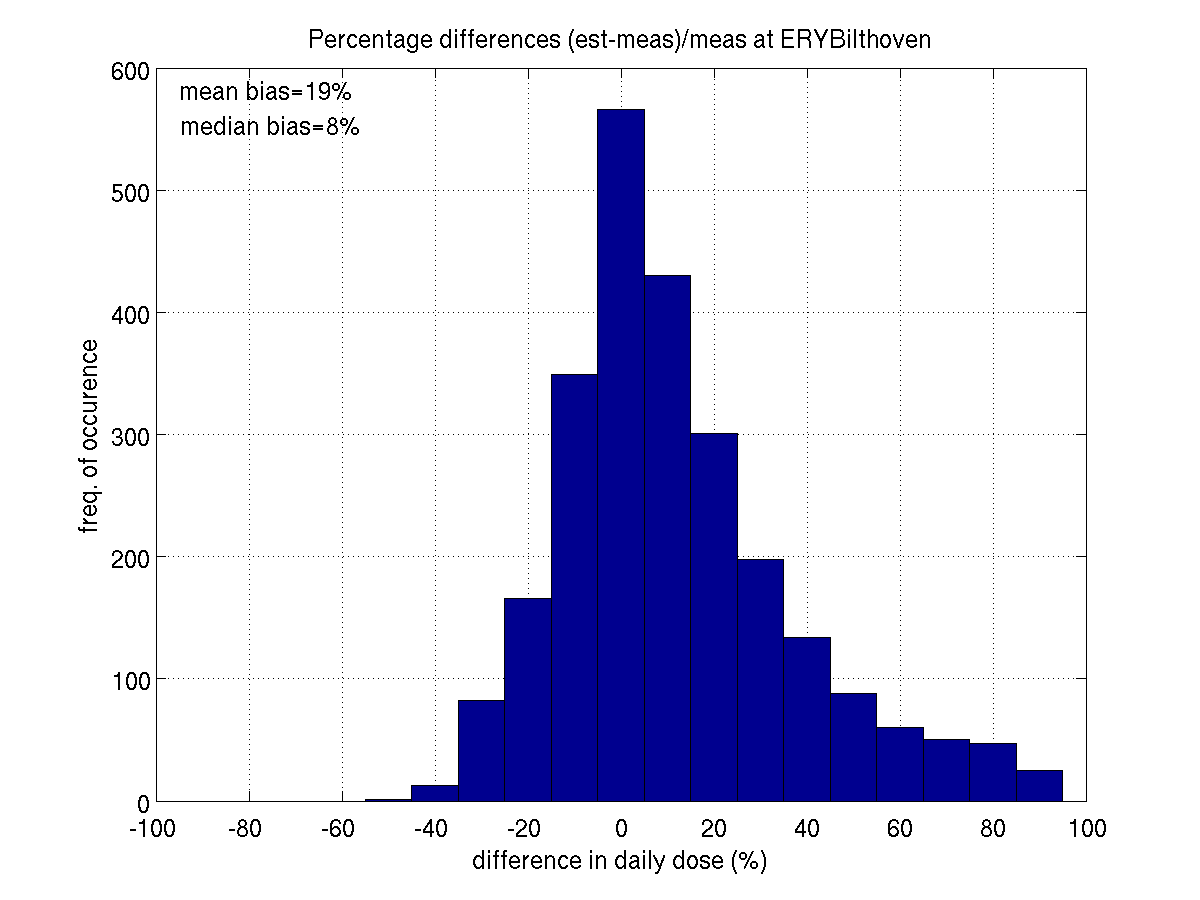
overestimation. The new algorithm shows a median overestimation
typically ranging from +8 to +17%, and mean bias ranging from +19 to
27% with 51 to 62% of the satellite-retrieved daily doses being within
plus/minus 20% from the ground-based reference (here, typically means
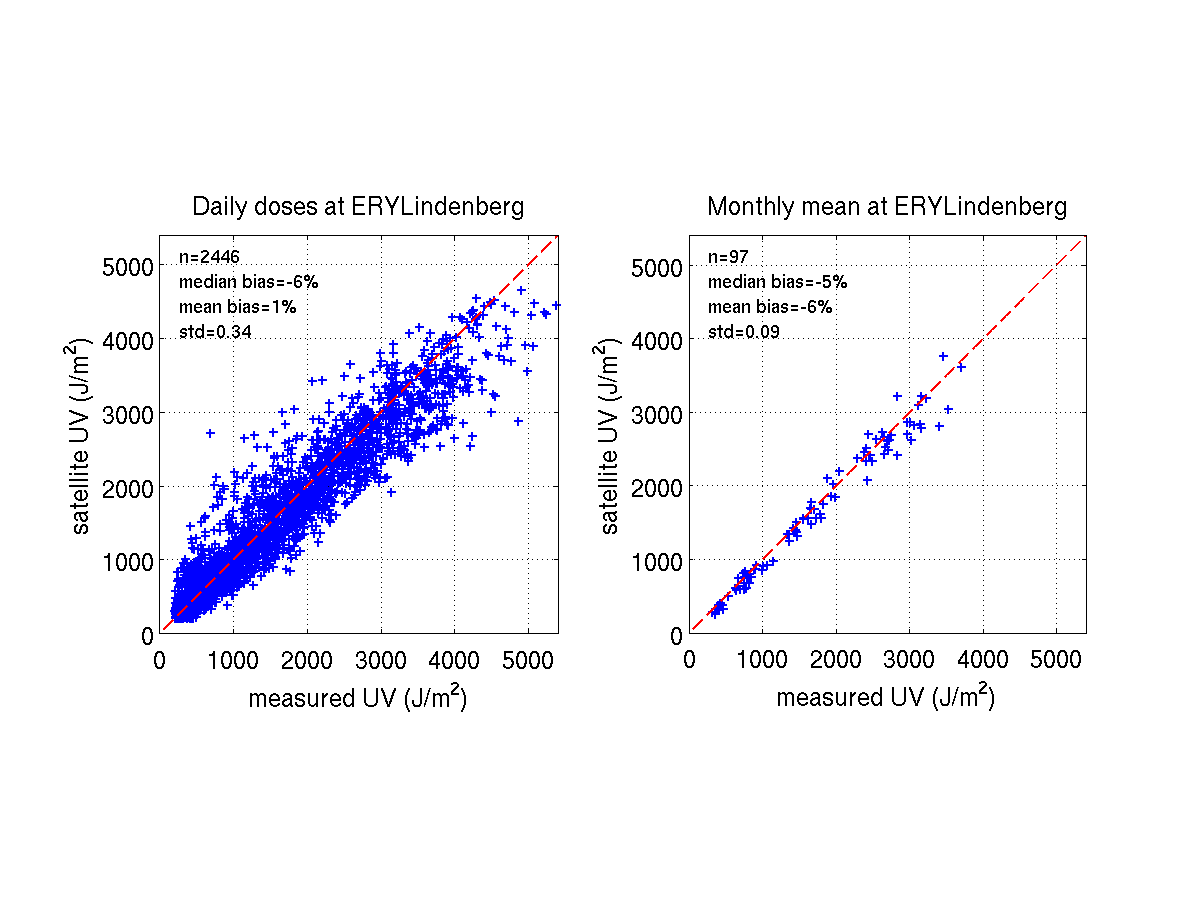
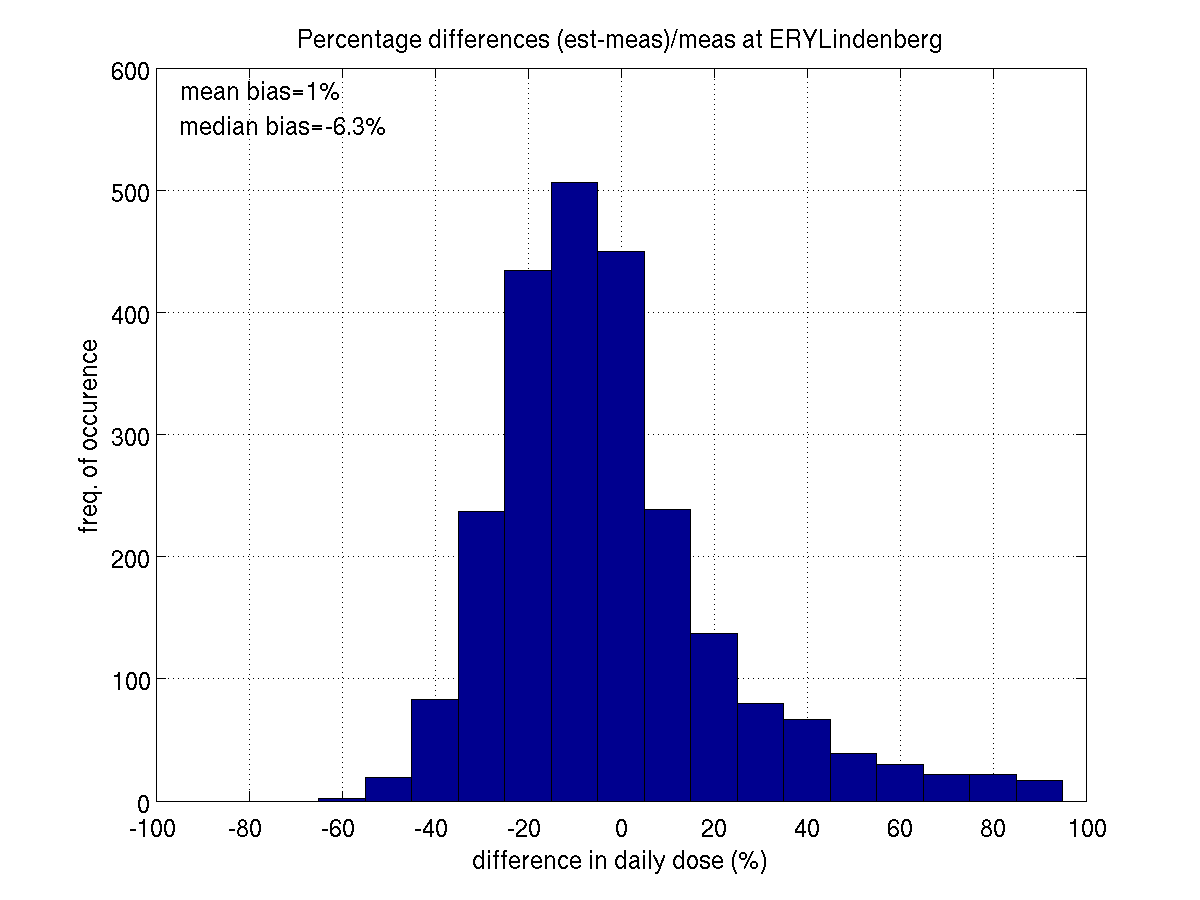
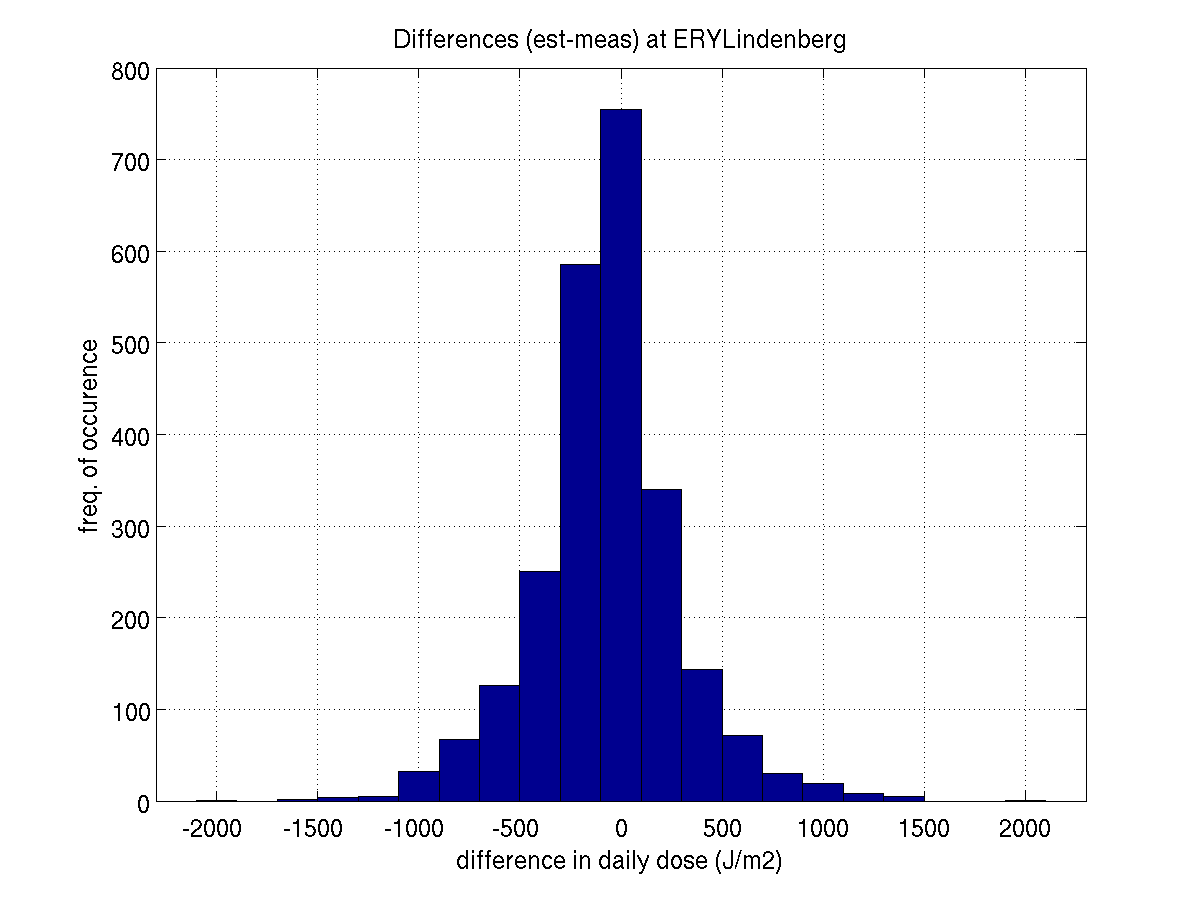
that the highest and lowest values were excluded). Lindenberg is an
exception from the general behavior, as the satellite-retrieved UV
doses there are close to the ground-based measurements: mean bias is
+1% and median bias is -6%.
Table 1. Results of the statistical error analysis. Numbers in table cells are also links
to correspoding figures (link opens in new window)
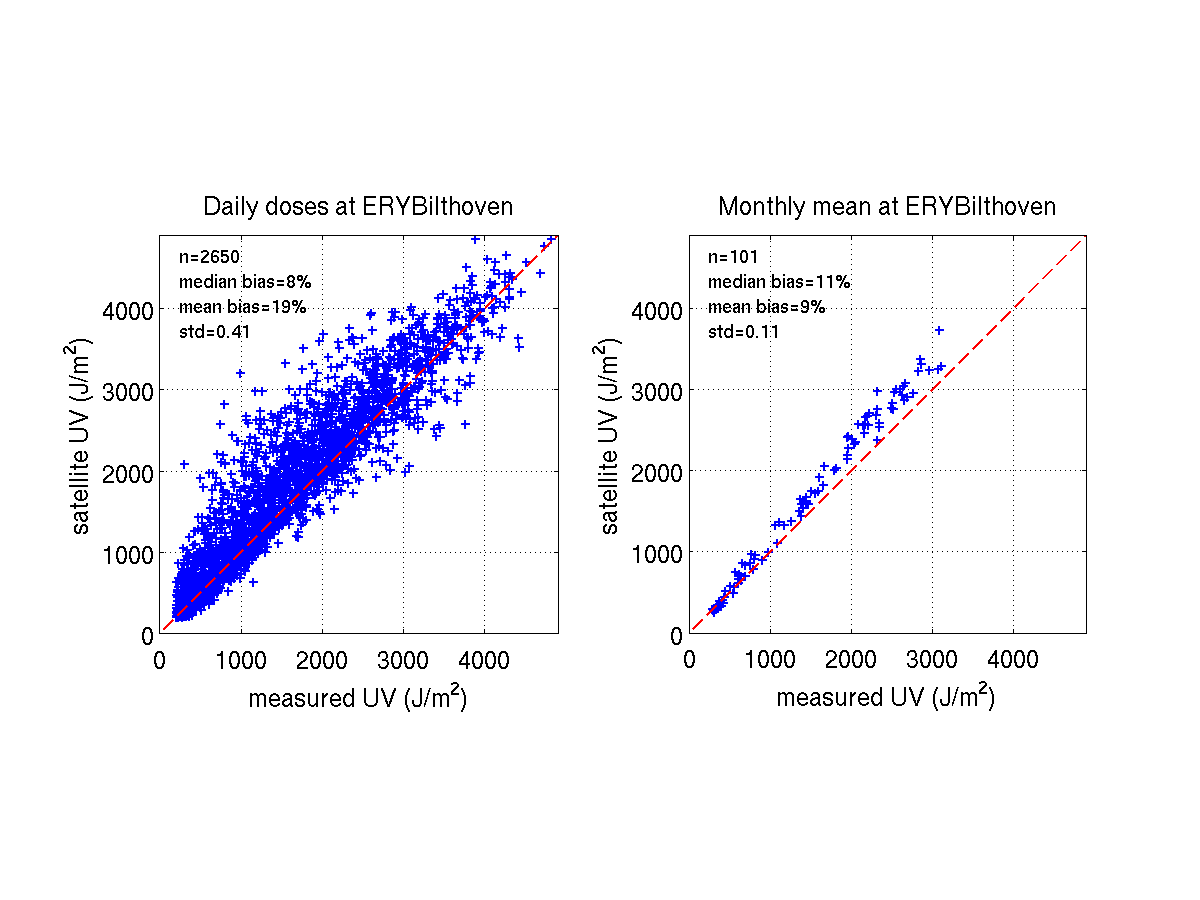
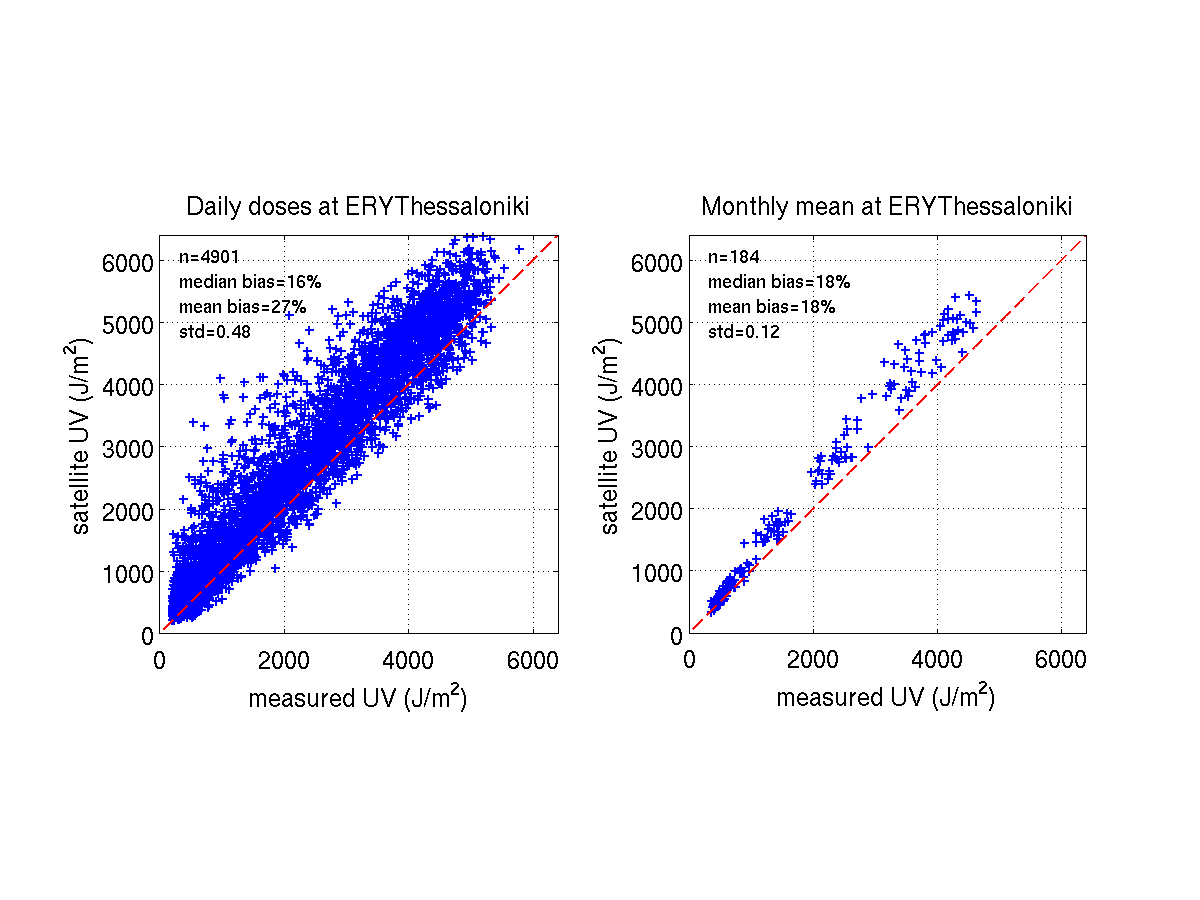
In addition to this summarizing table, we include some illustrative figures
of the validation results at each station. These figures show,
for instance, how some of the daily errors are averaged out when looking
at longer periods: the performance for the monthly mean values is clearly
better than for daily values, indicating that the method has potential to
serve as an information source for time series studies.
Look at the figures for the validation of satellite daily data data against ground based instruments:
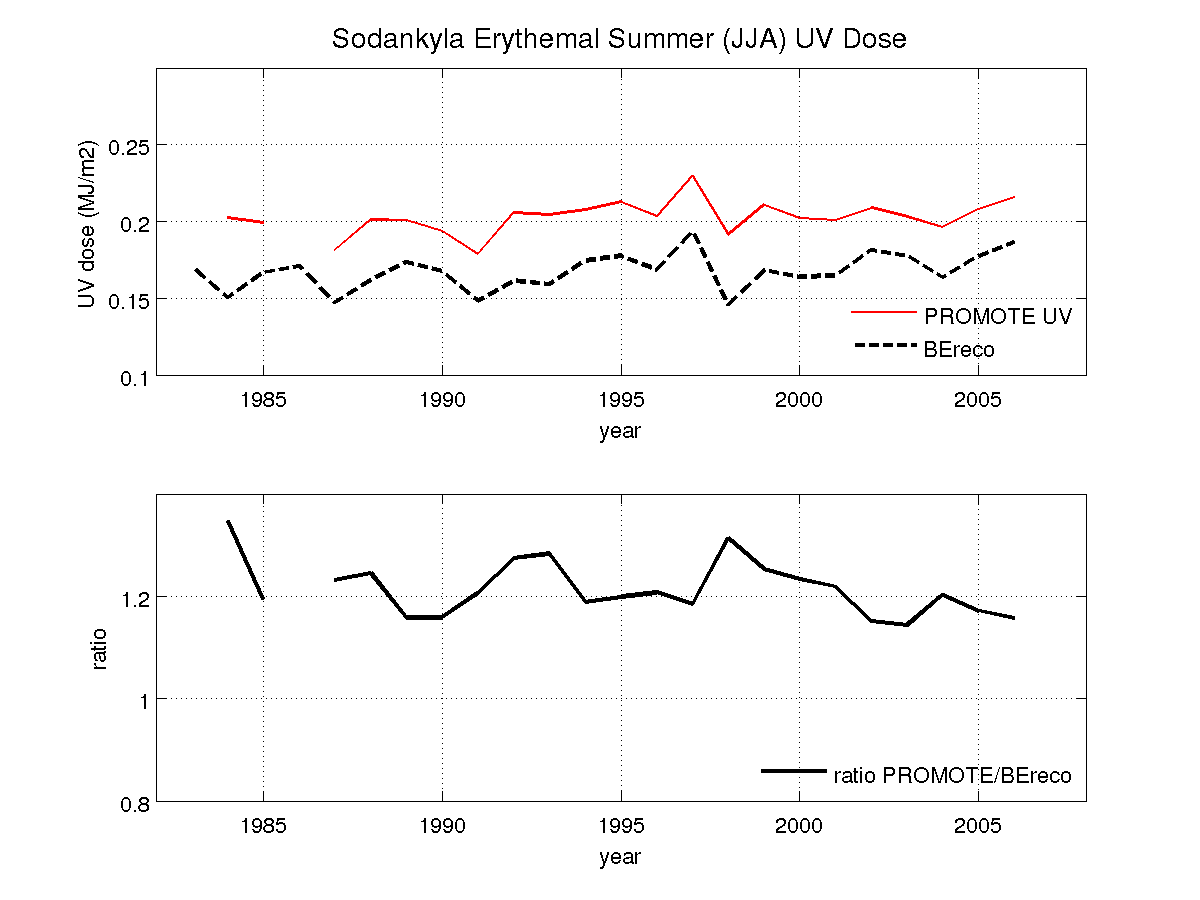
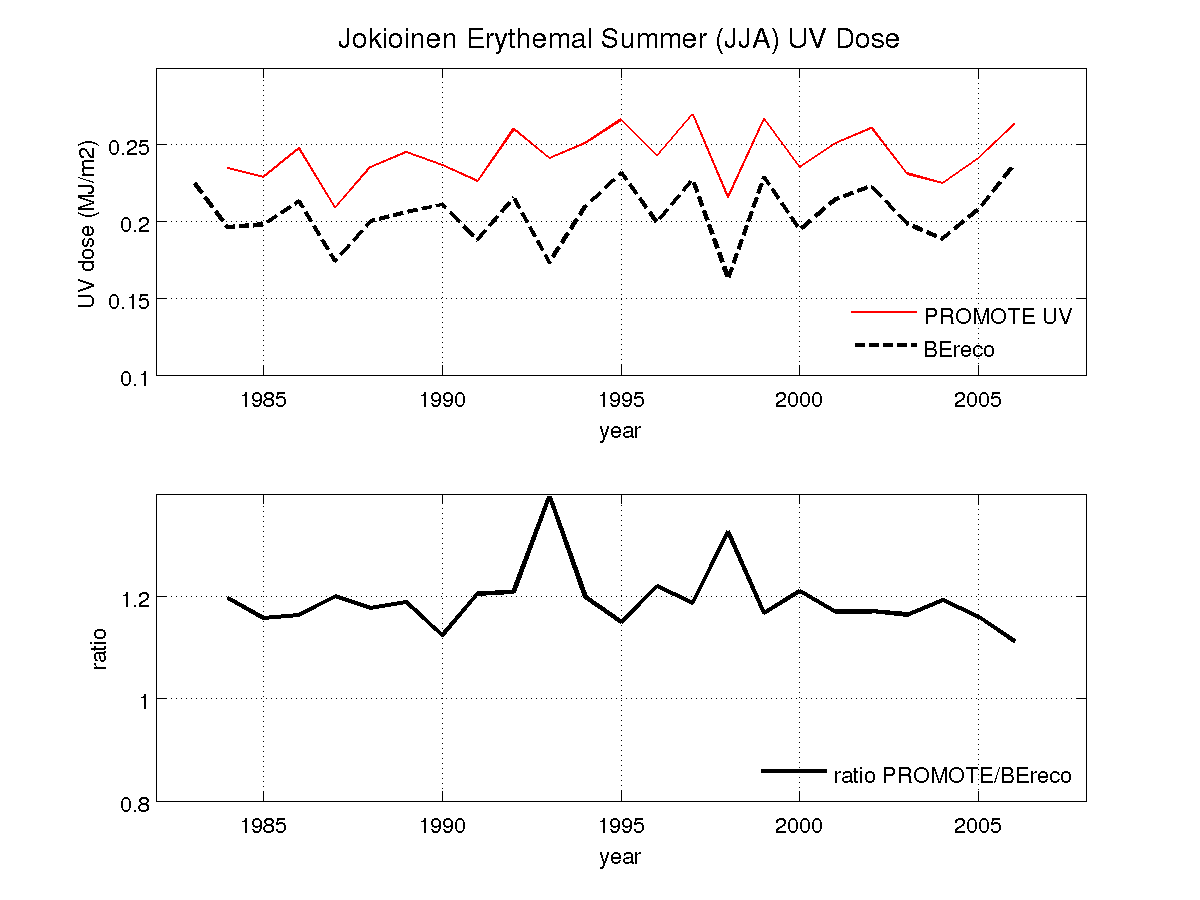
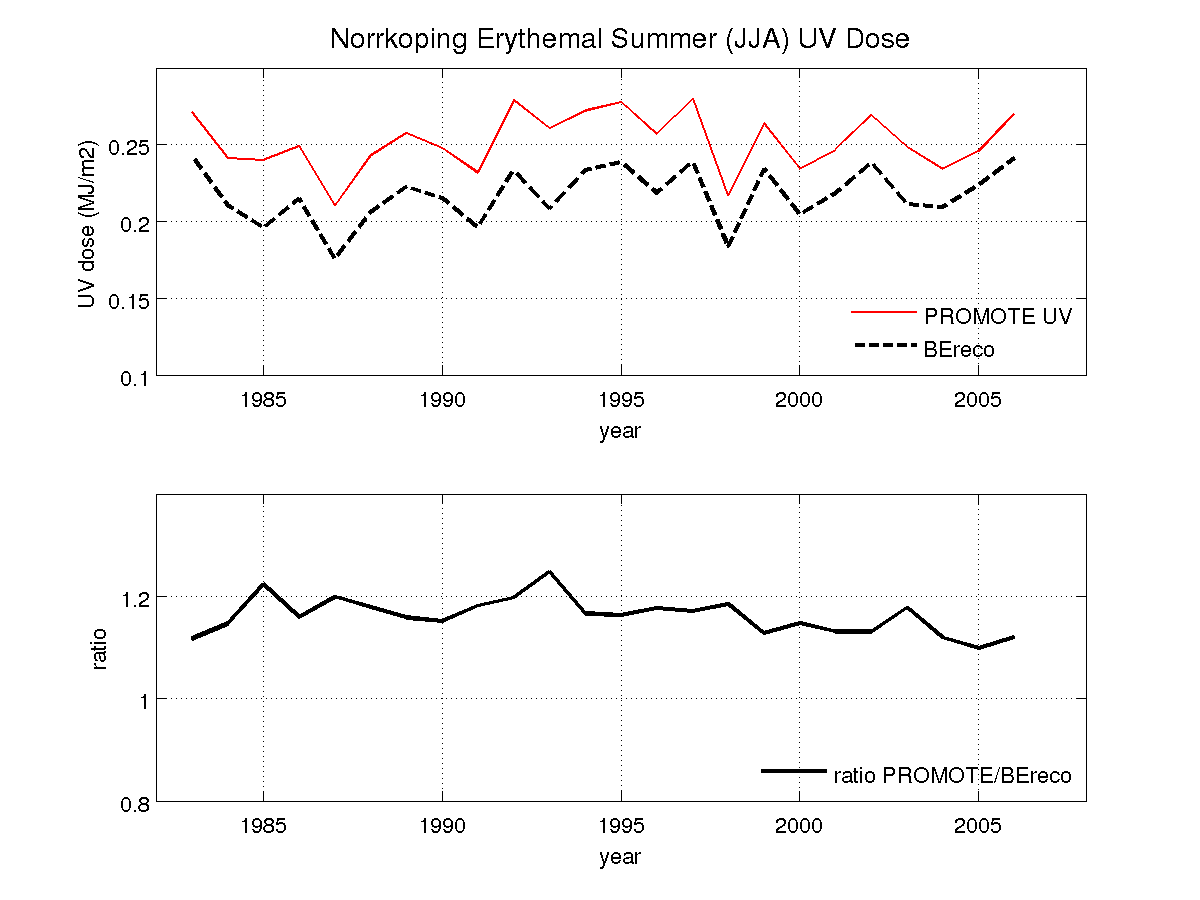
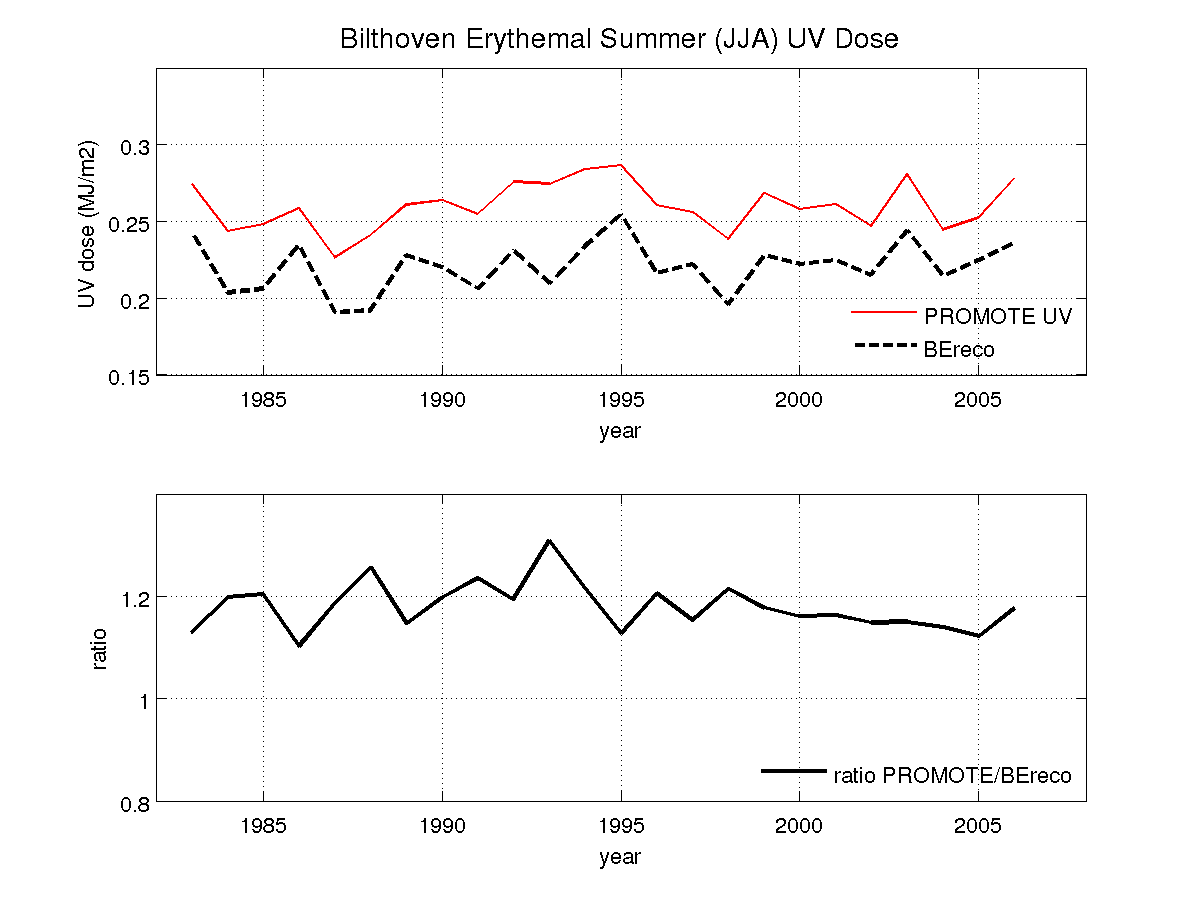
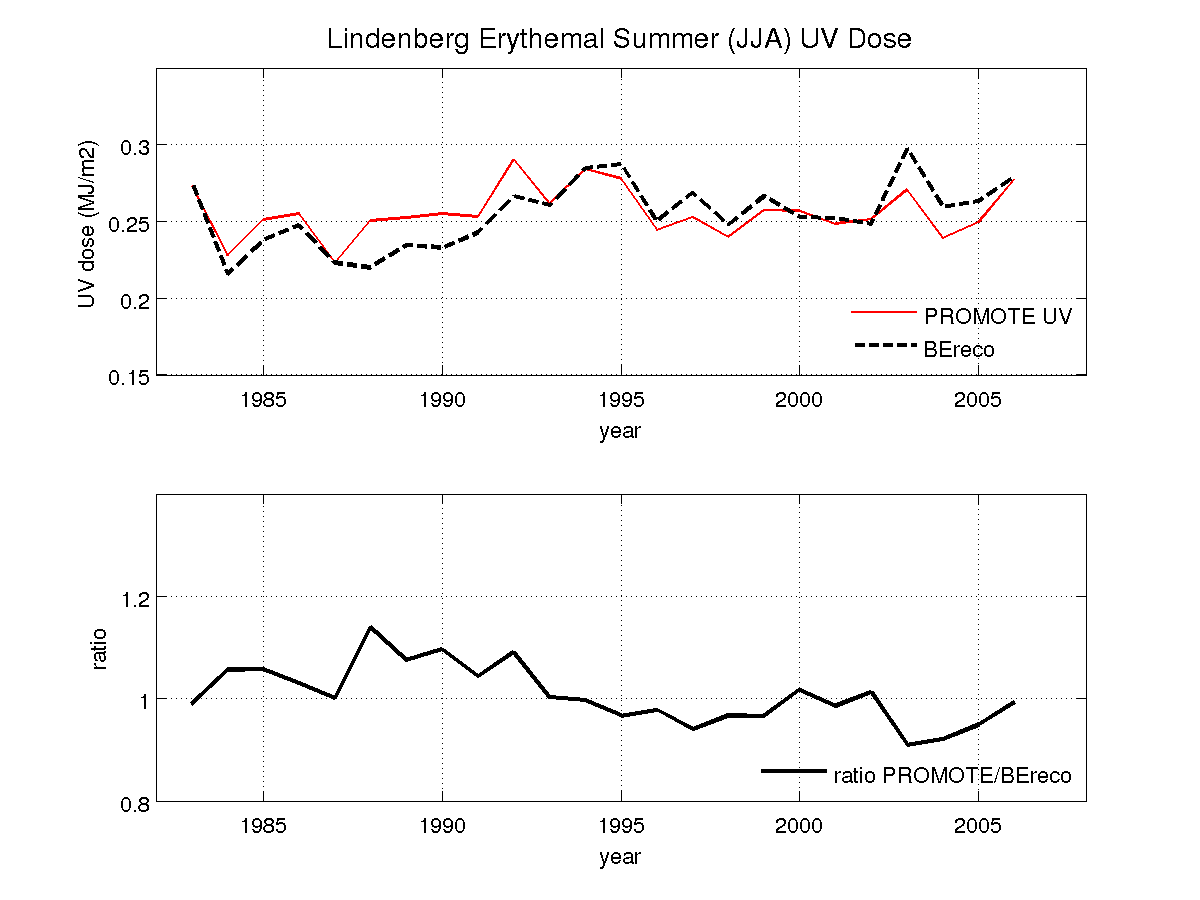
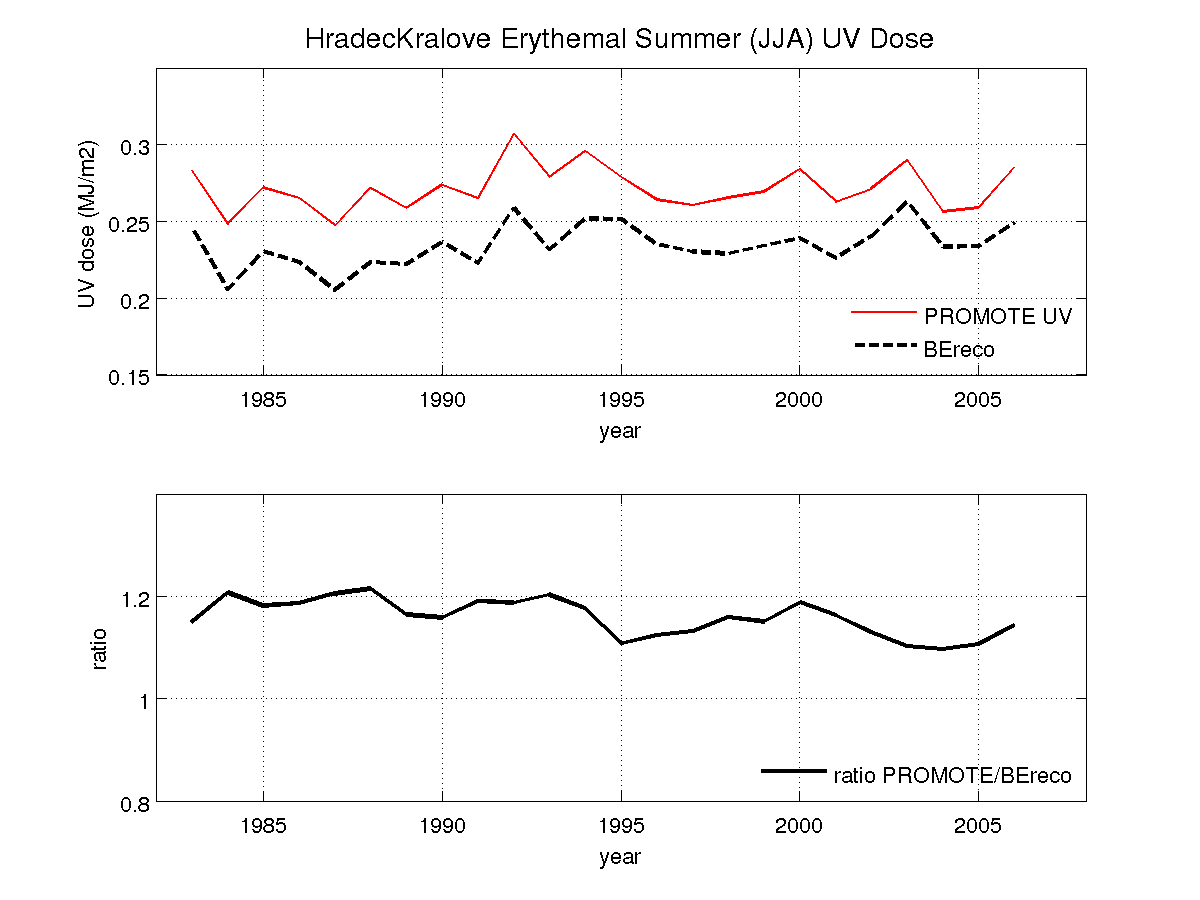
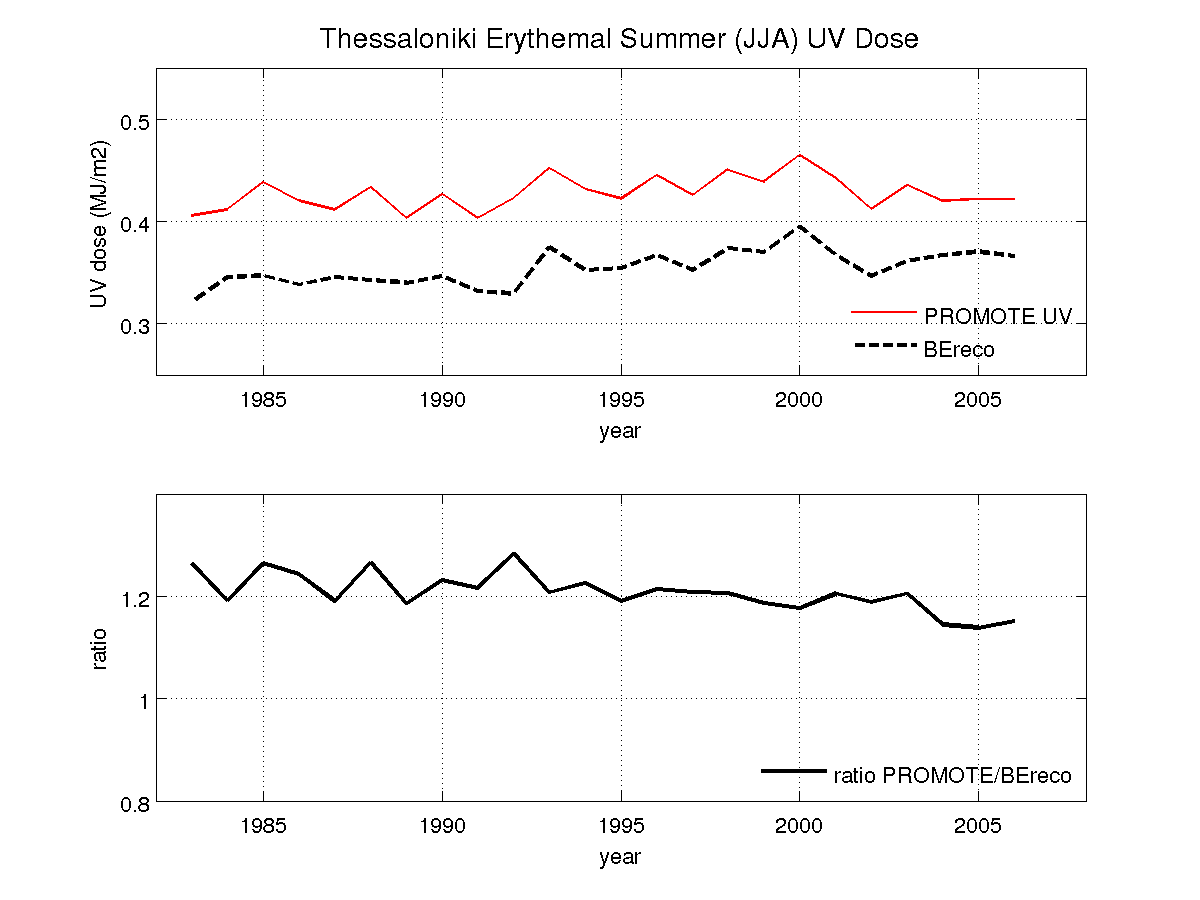
The long term summer (June-August) erythemal doses were calculated
from satellite daily doses and from reconstructed UV data produced in
the SCOUT-O3 project. The use of this reconstructed data set allows
one to have a picture of the behaviour of satellite data over the
whole period of Promote UV record (1983-2007) and to detect any long term
trends in the bias. The comparison of these two data sets
indicate that the typical bias of satellite data is about +20-30%,
which is consistent with the comparison with ground based instruments.
Again Lindenberg is an exception. For all sites there are
interannual variations in the bias, but in general no clear trend can be
seen in the bias.
Look at the figures for summer UV doses from satellite
and reconstructed data:
Satellite data against ground-based instruments:
SODANKYLA
 Back to the list
,
To the top of page
 Back to the list
,
To the top of page
 Back to the list
,
To the top of page
JOKIOINEN
 Back to the list
,
To the top of page
 Back to the list
,
To the top of page
 Back to the list
,
To the top of page
NORRKOPING
 Back to the list
,
To the top of page
 Back to the list
,
To the top of page
 Back to the list
BILTHOVEN
 Back to the list
,
To the top of page
 Back to the list
,
To the top of page
 Back to the list
,
To the top of page
READING
 Back to the list
,
To the top of page
 Back to the list
,
To the top of page
 Back to the list
,
To the top of page
LINDENBERG
 Back to the list
,
To the top of page
 Back to the list
,
To the top of page
 Back to the list
,
To the top of page
HRADEC KRALOVE
 Back to the list
,
To the top of page
 Back to the list
,
To the top of page
 Back to the list
,
To the top of page
THESSALONIKI
 Back to the list
,
To the top of page
 Back to the list
,
To the top of page
 Back to the list
,
To the top of page
Satellite data against reconstructed UV summer doses:
SODANKYLA
 Back to the list
,
To the top of page
Jokioinen
 Back to the list
,
To the top of page
Norrkoping
 Back to the list
,
To the top of page
Bilthoven
 Back to the list
,
To the top of page
Lindenberg
 Back to the list
,
To the top of page
Hradec Kralove
 Back to the list
,
To the top of page
Thessaloniki
 Back to the list
,
To the top of page
Jussi Kaurola, 31 August 2009