Introduction
In Phase 2 of PROMOTE (Stage 2), a new surface UV algorithm has been adopted: in order to have more homogeneous information on the cloudiness, we chose to use the cloud data from the International Cloud Climatology Project (ISCCP). This data is available on a global 280 km equal area grid, providing cloud fraction and cloud optical depth, of the cloud-covered part of the pixel, with a temporal resolution of 3 h. In addition to this cloud data, the algorithm takes as input the total ozone column from the Ozone Record Service of PROMOTE, and assumes climatological aerosols as provided by the Global Aerosol Data Set (GADS). More details on the algorithm are available elsewhere.At this stage (June 2008), the UV Record Service provides only a prototype dataset that covers the period July 2002 to June 2005. The full, long-term multi-sensoral UV Record will be made available later. This prototype data set has been validated against erythemal UV doses by ground-based instruments at seven European stations. The selected seven high quality stations (Sodankyla, Jokioinen, Norrkoping, Bithoven, Lindenberg, Hradec Kralove, and Thessaloniki) were chosen because their data are conveniently available within the SCOUT-O3 EU funded project, where FMI is also participating. In practice, the aim of the validation in Phase 2 is to determine typical bias and spread of the satellite-retrieved daily UV doses as compared to the ground-based reference. Most reference stations have data starting from the early or mid 1990s. However, the station of Norrkoping has data available already since 1983, and will thus make an important contribution to validating the performance of the complete long-term satellite-retrieved UV record.
Comparison against measured daily UV doses
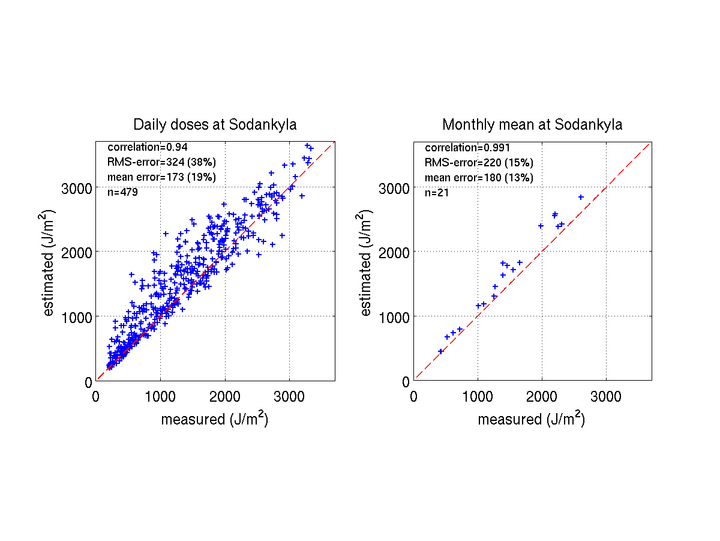
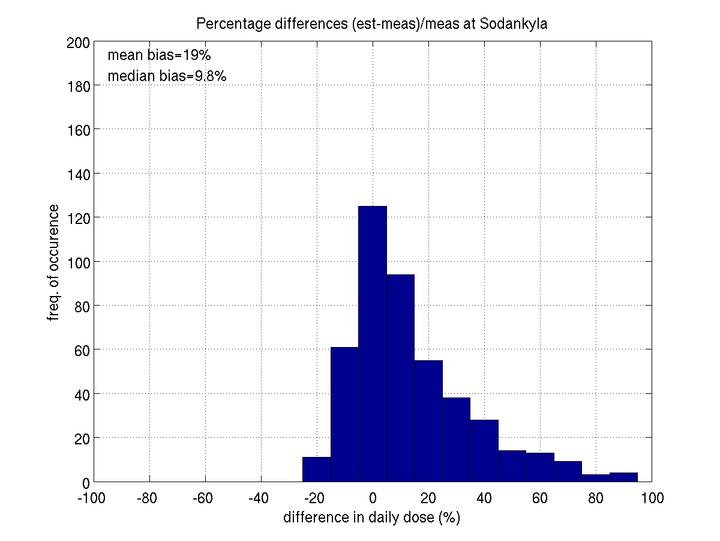
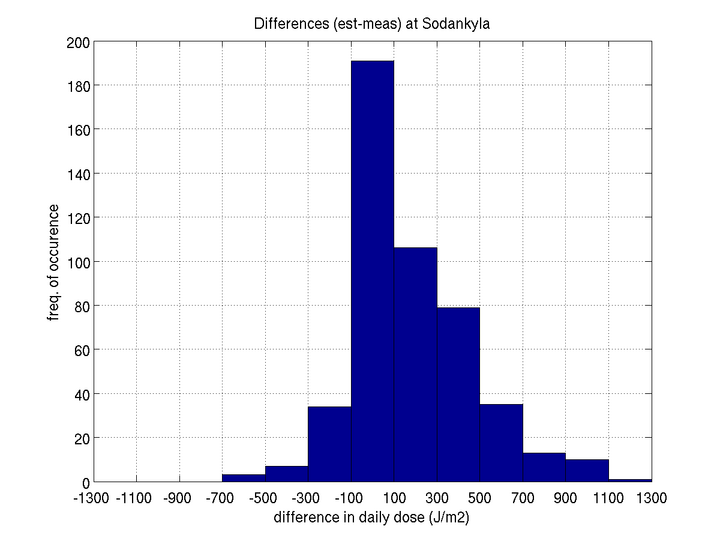
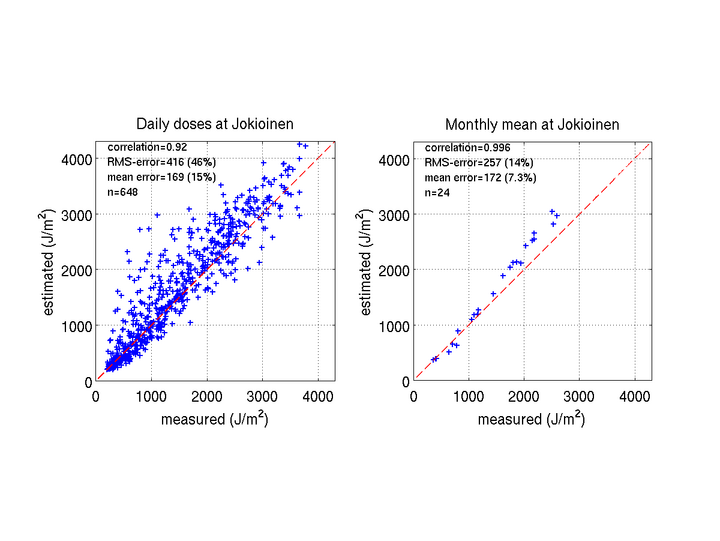
The satellite-retrieved erythemal UV doses over the period July 2002 to June 2005 were compared to ground-based measurements at the above-mentioned seven European sites. Following the paper by Tanskanen et al. (2007), we applied a threshold filter of 200 J/m2 to the daily doses, so that only doses exceeding that value were included in the validation analysis. For each station, we examined the following quantities in order to assess the performance of the satellite-retrieved data:- mean bias = mean value of percentage deviation as compared to reference data, i.e., mean([est-ref]/ref*100%)
- median bias = median value of percentage deviation as compared to reference data, i.e., median([est-ref]/ref*100%)
- std = standard deviation of ratio of estimated to reference value, i.e., std(est/ref)
- W20 = amount (relative frequency in %) of values found within plus/minus 20% from the reference
Table 1. Results of the statistical error analysis.
| Station |
mean bias |
median bias |
std |
W20 |
| Sodankyla |
19% |
10% |
0.33 |
66% |
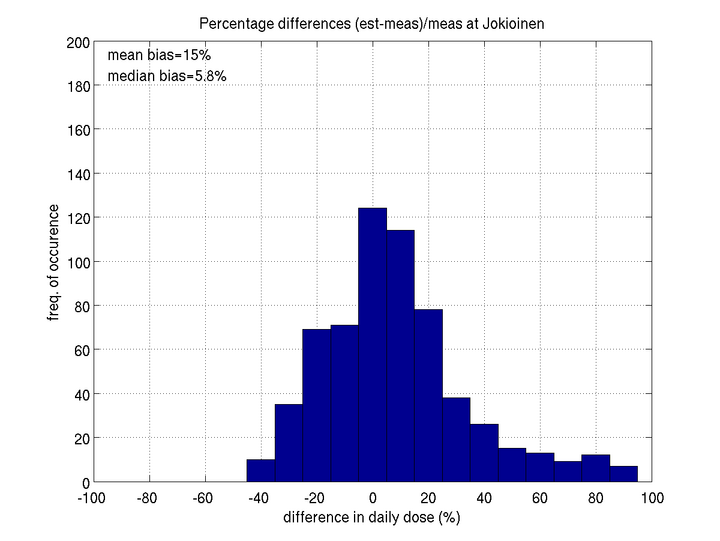
| Jokioinen |
15% |
6% |
0.43 |
59% |
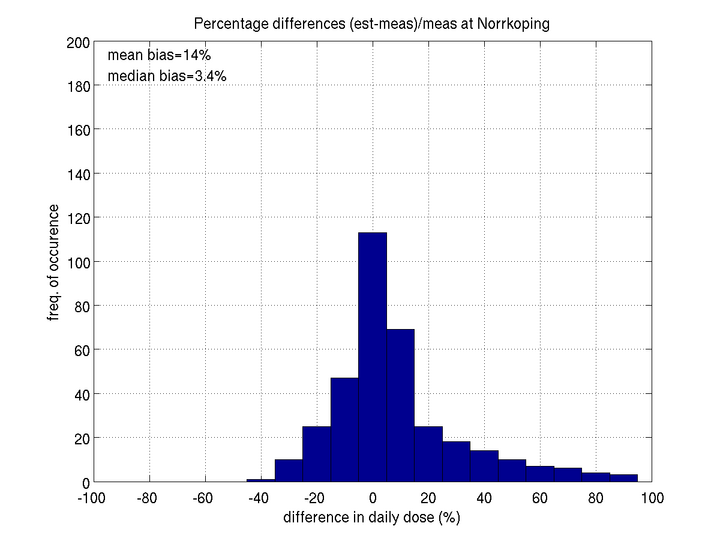
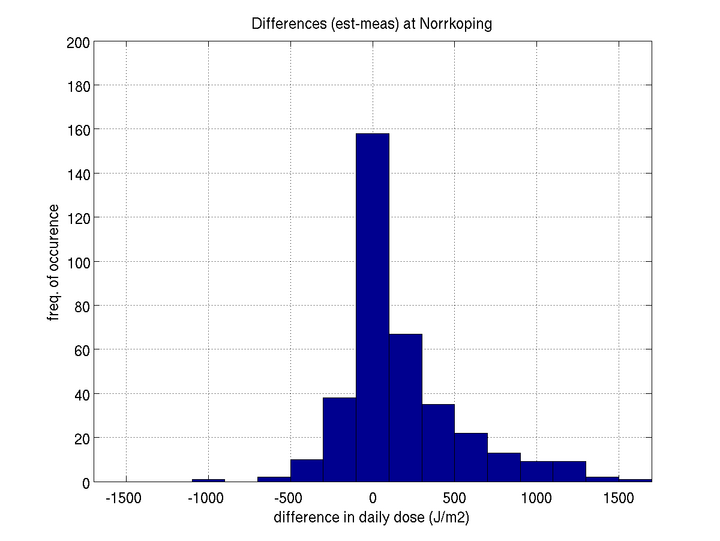
| Norrkoping |
14% |
3% |
0.40 |
69% |
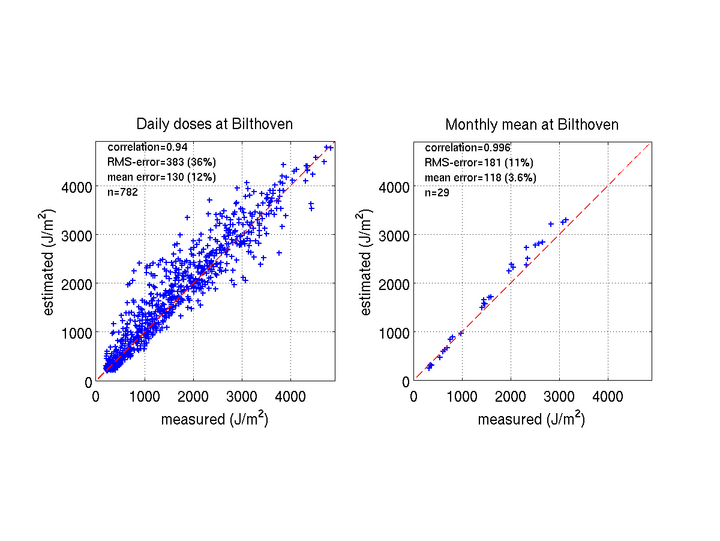
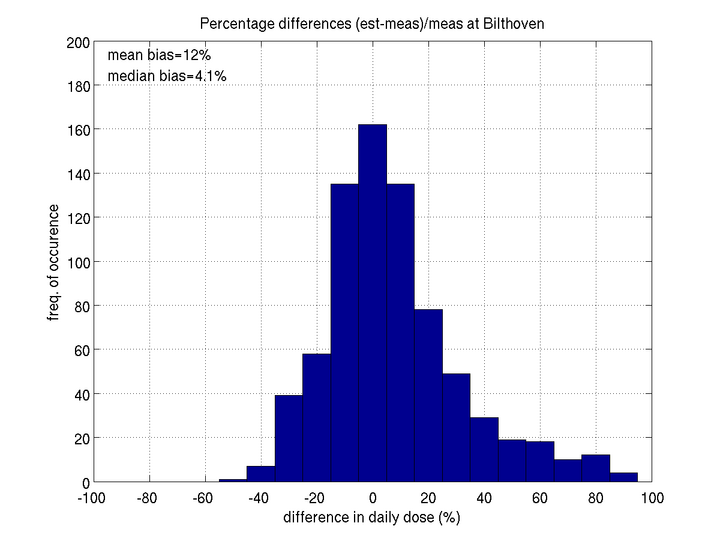
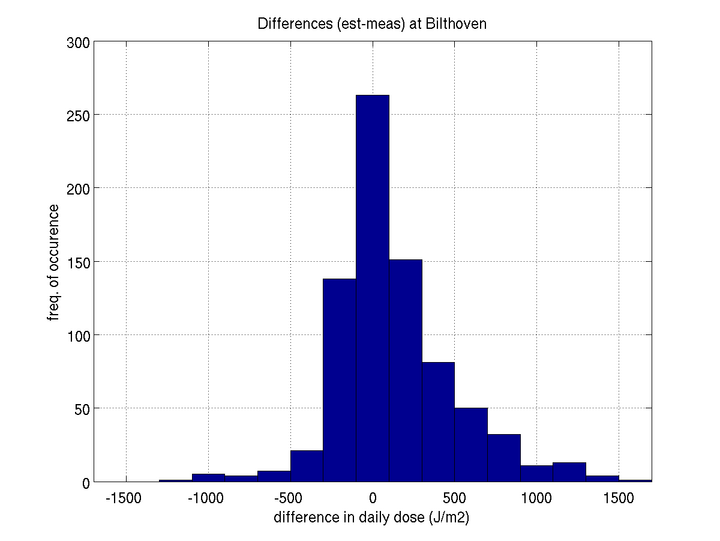
| Bilthoven |
12% |
4% |
0.34 |
65% |
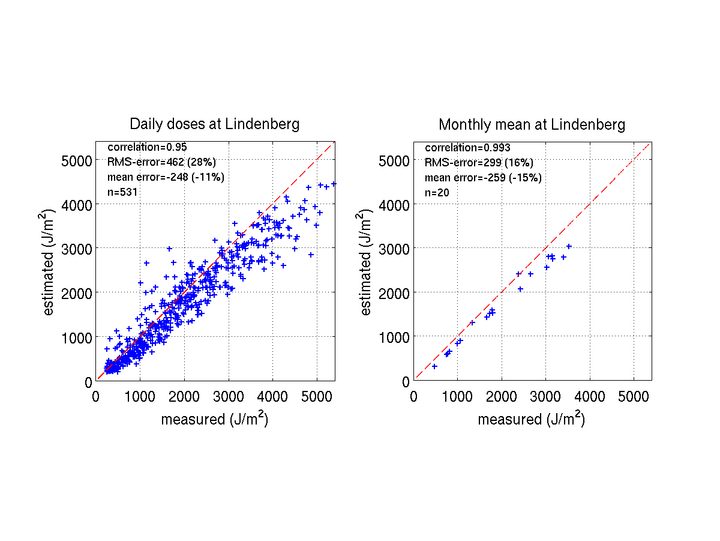
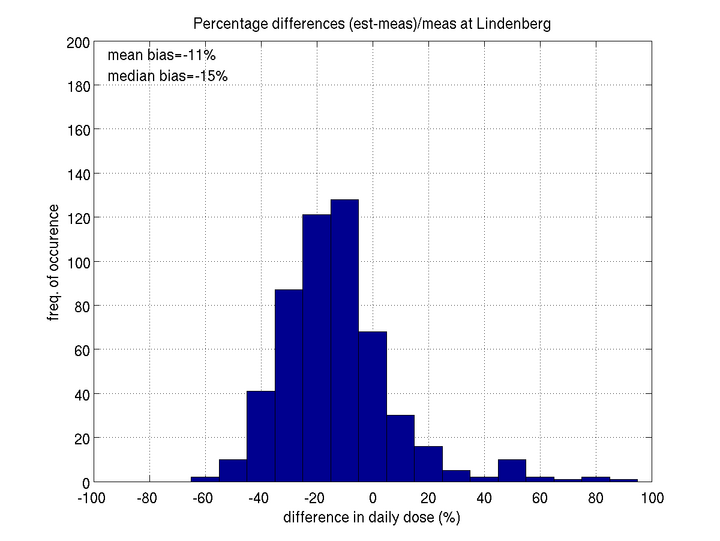
| Lindenberg |
-11% |
-15% |
0.26 |
56% |
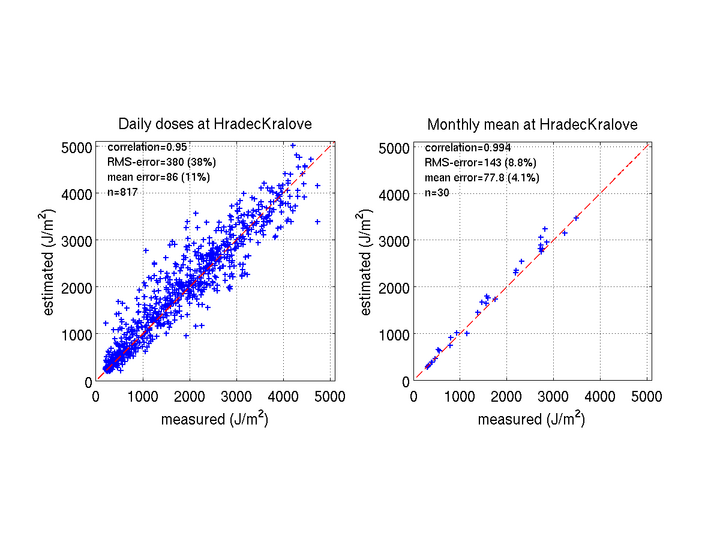
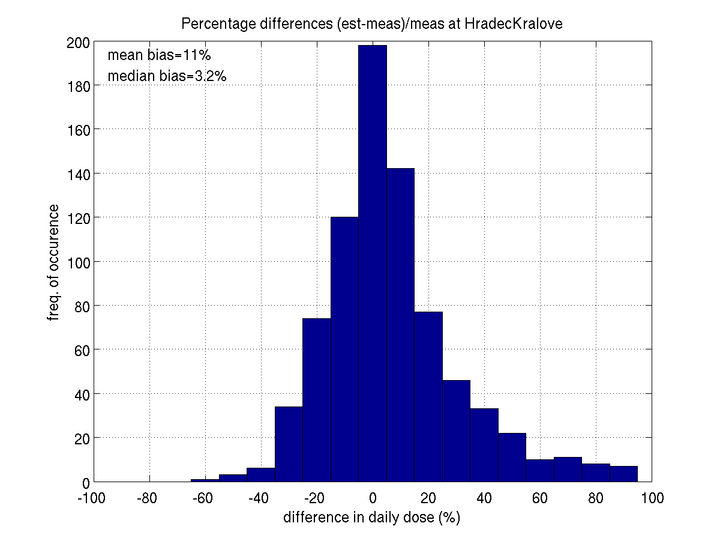
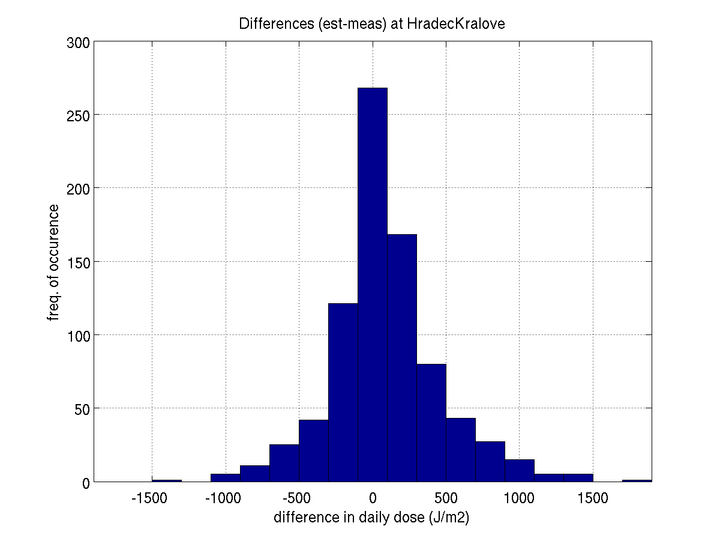
| Hradec Kralove |
11% |
3% |
0.36 |
68% |
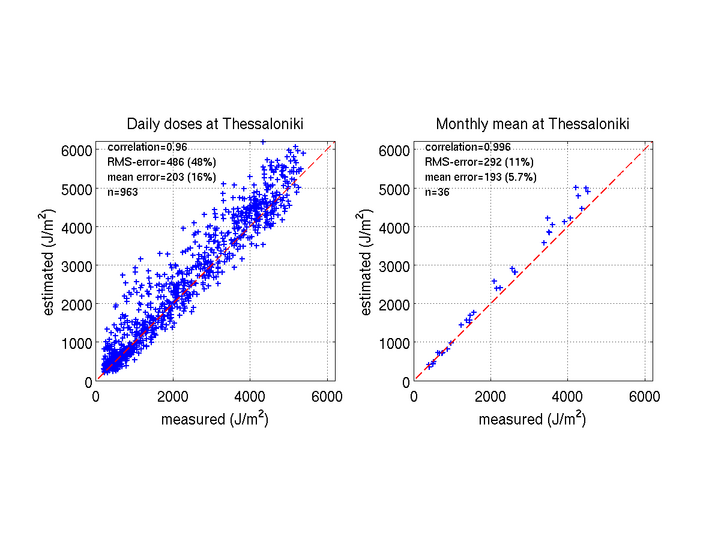
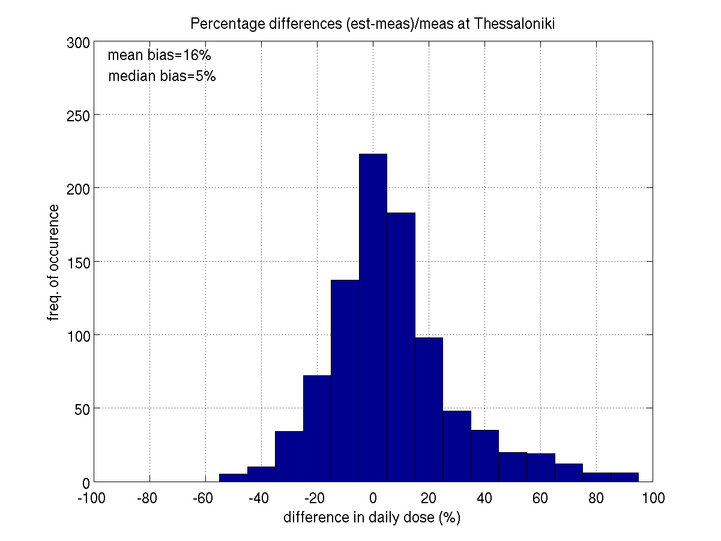
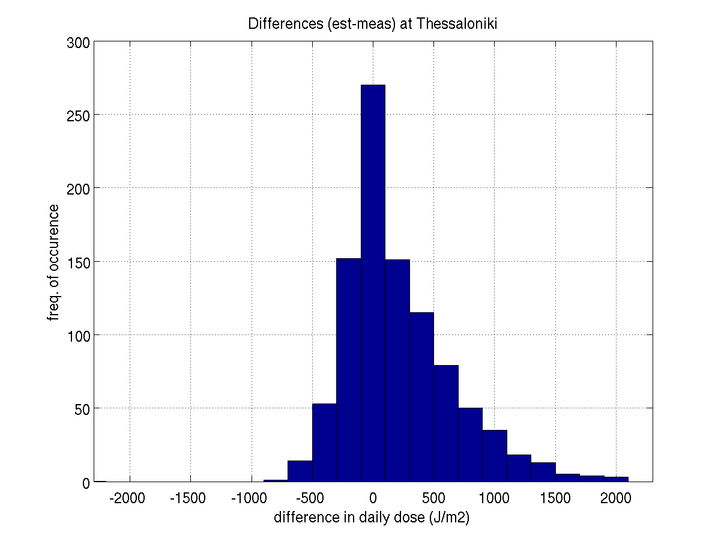
| Thessaloniki |
16% |
5% |
0.45 |
68% |
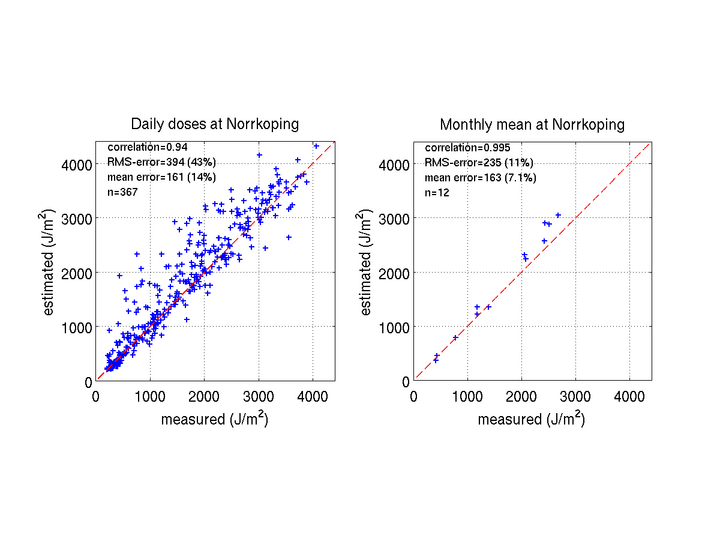
In addition to this summarizing table, we include some illustrative figures of the validation results at each station. These figures show, for instance, how some of the daily errors are averaged out when looking at longer periods: the performance for the monthly mean values is clearly better than for daily values, indicating that the method has potential to serve as an information source for time series studies.
Look at the figures for:
Discussion
It should be noted that the satellite-retrieved and ground based dose values are not fully comparable, and also the ground based data involves some uncertainty. Because of the relatively large ground pixel size (the ISCCP cloud data is originally in an 280km equal area grid), the satellite-retrieved dose values represent an average dose for a larger region than those based on the ground based measurements. A more detailed analysis (not shown here) shows that indeed some of the overestimation in the satellite algorithm can be attributed to the cloud information in the ISCCP data, which gives too weak cloud attenuation in particular during days with heavy clouds according to ground measurements.
Figures: SODANKYLA
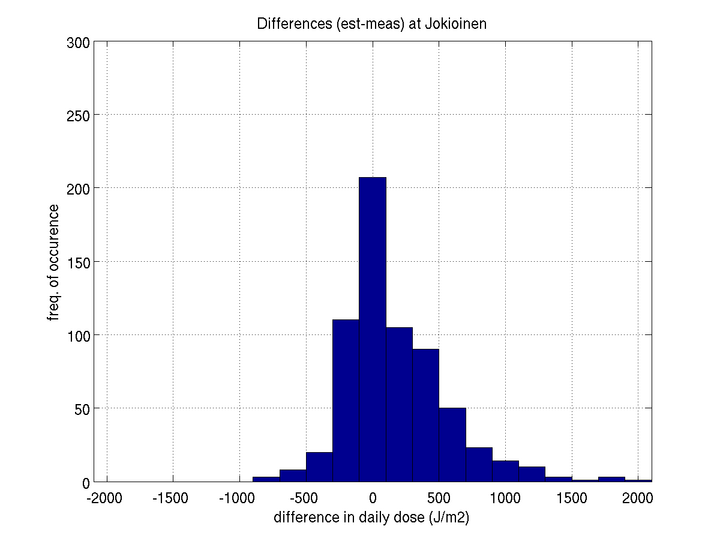
Figures: JOKIOINEN
Figures: NORRKOPING
Figures: BILTHOVEN
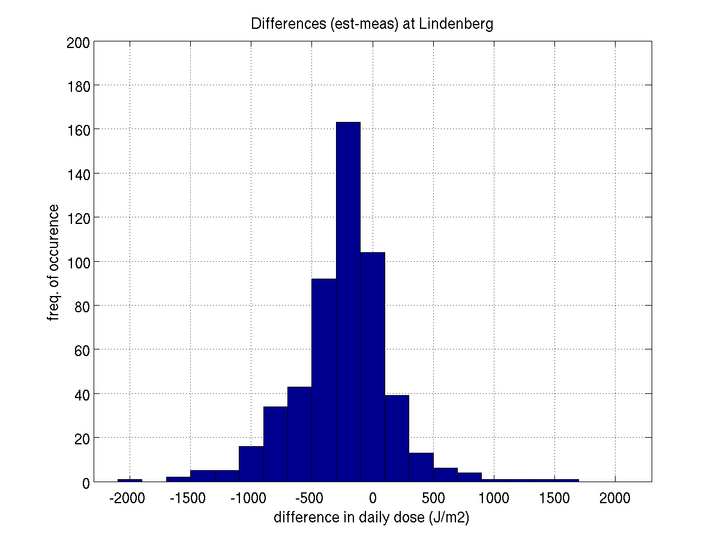
Figures: LINDENBERG
Figures: HRADEC KRALOVE
Figures: THESSALONIKI
Anders Lindfors, June 2008