Introduction
| The PROMOTE UV Record erythemal
daily doses based on the EP/TOMS
measurement data were compared with the daily doses determined from the
spectral UV measurements made with a double monochromator Brewer
instrument at Jokioinen observatory. Jokioinen is located in the
Southern Finland (60.81N, 23.50E, 104 amsl) and climatologically
it represents boreal forest region. The Brewer instrument of Jokionen is
shown in Figure 1. Eight year of data (1997-2004) were included in the
comparison. The overpass satellite data for Jokioinen were prepared by
selecting the satellite observation closest to the ground station and
that was made within 12 hours from the local solar noon. The reference
daily doses were calculated as integrals from erythemal dose rates
calculated from cosine corrected Brewer spectra using trapezoid rule.
Several criteria were used to ensure that the coverage of the spectral
measurements was sufficient for accurate determination of the daily
doses. The overall number of validation data pairs was 2156, ie.
covering some 75% of the time period under study. It should be noted
that the satellite retrieved and ground based dose values are not fully
comparable and also the ground based data involves some uncertainty.
Because of the relatively large ground pixel size, the satellite
retrieved dose values represent average dose value for a larger region
that those based on the ground based measurements. Therefore, satellite
retirevals are problematic for regions with large variation in albedo
or topography. |
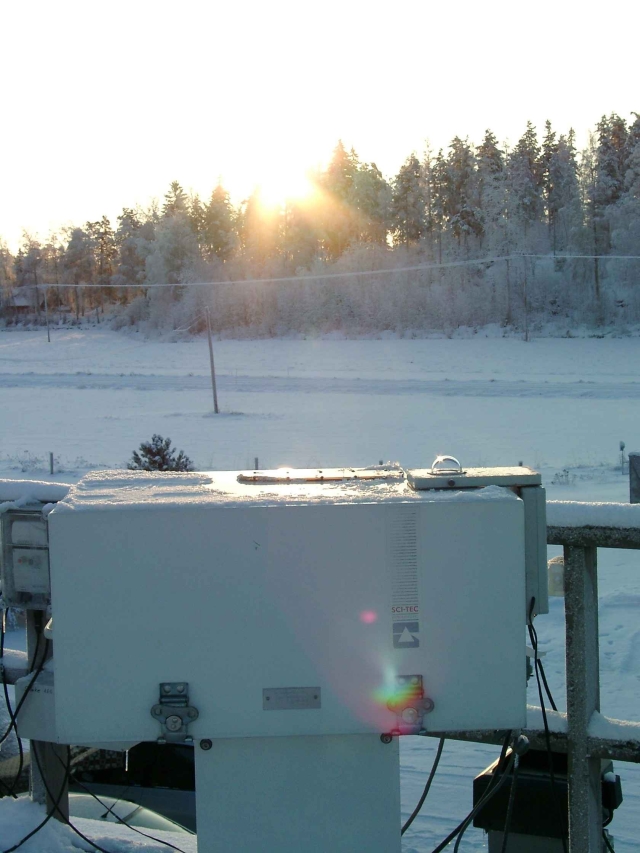
Figure 1. Brewer instrument in January 2002 in Jokioinen.
|
Comparison of the daily doses
In Figure 2 are shown both the satellite retrieved erythemal daily
doses for Jokioinen and the daily doses defined from the Jokioinen
Brewer measurement data. Figure 3 shows the satellite daily doses (Ds)
as a function of the Brewer doses (Dg). Figures 4 and 5 show the
absolute (Ds-Dg) and relative (Ds-Dg)/Dg differences of the two data
sets. Naturally, the absolute differences are largest in summer, as the
daily dose values are largest. The relative difference reveals a
seasonal pattern: satellite retrieved doses are on the average some 15%
larger than ground based doses in summer, while in winter they are
smaller than those derived from the ground based measurement data. The
summertime positive bias of the satellite retrieved surface UV is in
accordance with previous validation studies and can be at least partly
addressed to absorbing aerosols that are not currently taken into
account by the surface UV retrieval algorithm. The wintertime negative
bias is not as serious problem, because the dose values are in general
very low. However, it could be explained by an error in the assumed
surface albedo. Figure 6 shows the histogramm of the relative
differences between the doses. Clearly, the distribution is skewed and
peaks at some 15%. The percentage of the data pairs within 10%, 20% and
30% from each other are 22%, 47% and 67% respectively.
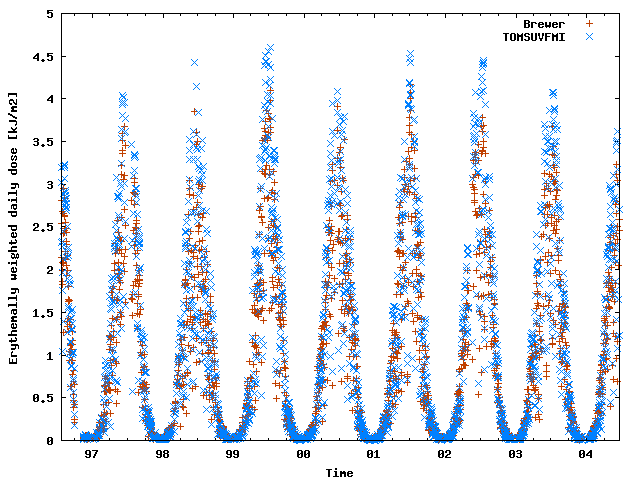
Figure 2. Satellite retrieved and Brewer measurement based erythemally
weighted daily doses.
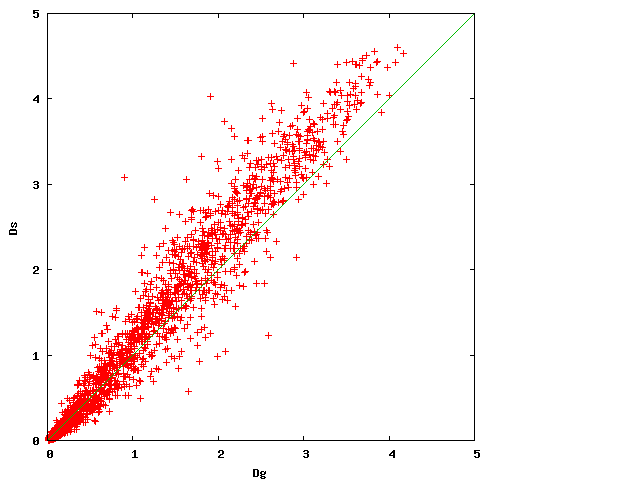
Figure 3. Satellite retrieved daily dose (Ds) as a function of the
ground based dose (Dg)
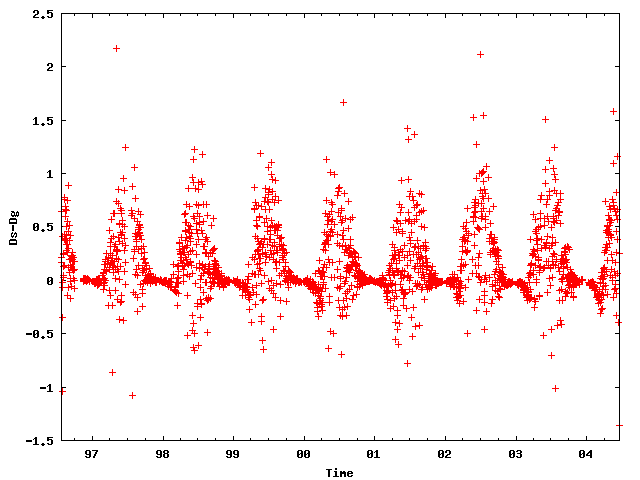
Figure 4. Absolute diffrence between the satellite retrieved and the
ground based daily dose.
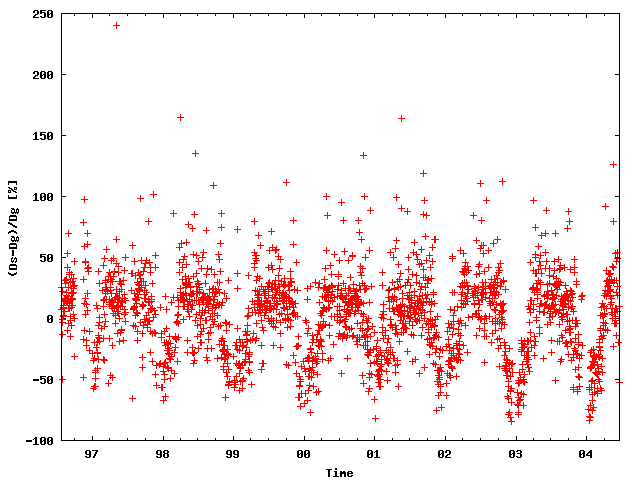
Figure 5. Relative diference between the satellite retrieved and the
ground based daily dose.
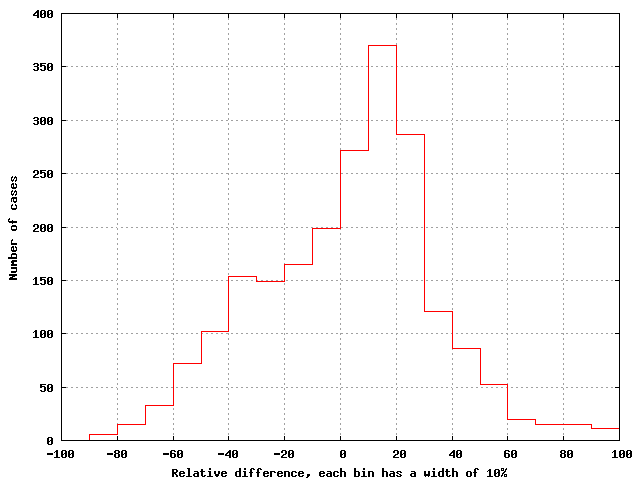
Figure 6. Histogramm of the relative difference between the satellite
retrieved and ground based daily doses.
Comparison of the monthly averages of daily doses
In addition to daily doses monthly average daily doses were determined
and compared. The averages were calculated requiring that sufficient
number of faily dose values were available for each month from both the
satellite and ground based measurements. This resulted in 80 monthly
average pairs. Figure 7 shows the correllation between the monthly
averages based on the satellite retrieval (Ds) and ground based
measurements (Dg). The positive bias in the monthly average satellite
retrieved daily dose is naturally the same as that for daily doses, but
now the variance is significantly smaller. There is a good explanation
for this: the cloud correction of the satellite retrieval algorithm
involves much uncertainty because it is based on a single observation
of the cloud conditions. However, these observations can be considered
as samples of the true cloud information, and therefore the uncertainty
decreases as more samples on the cloud conditions are used to calculate
the average.
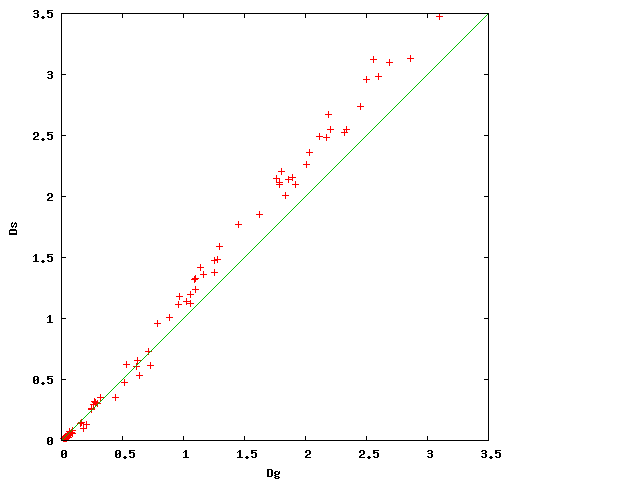
Figure 7. Monthly average satellite retrieved daily dose (Ds) as a
function of the monthly average ground based dose (Dg)
.
Results of the statistical analyses and conclusions
The statistical results of the validation comparison are summarized in
Table 1. The mean error and the relative mean error for daily doses and
for monthly averages differ because in the set of daily doses there
were some gaps in data, and thus, when monthly averages are calculated
the wintertime data (which tends to give negative bias) are given more
weight.
Table 1. Results of the statistical error analysis.
Statistical Quantity
|
Daily doses
|
Monthly average daily doses
|
Number of value pairs
|
2156
|
80
|
| Mean error |
0.15 kJ/m2 |
0.13 kJ/m2 |
Relative mean error
|
3.1%
|
1.3%
|
Root mean squared (RMS) error
|
0.34 kJ/m2
|
0.21 kJ/m2
|
Root mean squared (RMS) relative
error
|
33.1%
|
21.0%
|
Doses within 10%
|
22%
|
25%
|
Doses within 20%
|
47%
|
68%
|
Doses within 30%
|
67%
|
88%
|
This validation study does not give a complete picture of the quality
of the UV Record data. However, some general data features were
established. At least for Jokioinen, the TOMSUVFMI surface UV algorithm
tends to give too high daily dose values in summer and too low doses in
winter. Thus, there is a need to improve the surface UV
algorithm to better account for absorbing aerosols and seasonal changes
in surface albedo. The variance of the daily dose is high, but
decreases substantially for monthly averages. The daily dose values
could be improved provided that more data was available on the diurnal
variation of the cloud conditions.